Chapter I - A closer look at student outcomes
Section II - Alignment with student needs: Evidence from the university sector
Introduction
In this chapter we analyze bachelor degree outcomes of university graduates for six indicators described in Table 6. We examine each labour market related indicator for six months after graduation and two years after graduation. Data sources and definitions
Graduate outcome indicator | Measure | Data source | Time of collection |
|---|---|---|---|
| 1. Graduation | Among all students who enroll in a program, the percentage that graduate from it within a given time frame. Graduation rates are calculated 7 years after enrolment for 4-year programs. Shorter periods are used for shorter programs | Ministry KPI data | Not applicable |
| 2. Earnings | Total annual earnings before tax deductions and transfers among employed graduates. Inflation-adjusted with the Consumer Price Index for Ontario, indexed at 2010=100 |
OUGS – Self-reported gross earnings at time of survey | 2 years post-graduation. Graduates report earnings for 6 months post-graduation retrospectively and for October 2 years post-graduation |
LFS – Annual earnings derived from self-reported wage |
Age 22-29, 2009-2013 |
||
Synthetic, cumulative earnings age 26-64 |
NHS – Self-reported annual earnings from 2010 |
2011 (reference period is 2010) |
|
| Unemployment | Among graduates in the labour force, the percentage who are unemployed |
OUGS – Self-reported employment status at time of survey |
2 years post-graduation. Graduates report employment status for 6 months post-graduation retrospectively, and for October 2 years post-graduation |
LFS – The percentage of labour market participants who are not currently employed at time of survey |
2009-2013 |
||
| Labour force participation rate | Among all graduates, the percentage who are either employed or looking for employment |
OUGS – Self-report of being either employed or seeking employment at time of survey |
2 years post-graduation. Graduates report labour force status for 6 months post-graduation retrospectively, and for October 2 years post-graduation |
| Returned to education | OUGS – Self-report of being enrolled in post-secondary education |
2 years post-graduation. Graduates report returning to school for 6 months post-graduation retrospectively, and for October 2 years post-graduation |
|
| Employed in related field | Among employed graduates, the percentage who are working in a field related to their postsecondary education |
OUGS – Self-report of employed graduates working in a “job related to the program that [they] graduated from”. Only closely related are coded as in related work. |
2 years post-graduation. Graduates report employment in a related field for 6 months post-graduation retrospectively, and for October 2 years post-graduation |
Data sources and definitions
Data on labour market related outcomes come from the Ontario University Graduate Survey (OUGS), 2007-2011. Note that the OUGS is administered to university graduates two years post-graduation, so we are referring to graduates from the years 2007 to 2011, which are surveyed in the years 2009 to 2013. Participants are asked about their labour market outcomes at the time of the survey, as well as to recall their outcomes at six months post-graduation.
We present results for all university graduates and separate results for the six largest field-of-study (FOS) clusters, which contain about 71% of graduates. These FOS, and the percentage of the entire sample they comprise are Social Sciences (22.9%), Business and Commerce (11.7%), Humanities (11.4%), Education (10.9%), Engineering (7.3%), and Agriculture and Biological Science (7.1%).
Our approach to assessing student needs
Our approach is guided by two key questions:
What are the trends over the last five years by field of study?
We start by describing overall trends in outcomes for the degree at six months and two years post-graduation. Because we are only considering one credential in this chapter, we place more emphasis on FOS comparisons. We consider both how graduate outcomes compare by major FOS clusters as well as whether these comparisons change over time.
Where relevant, we explore whether changes in graduate outcomes over the last five years are statistically significant. We answer this question for university graduates as a whole and for the six FOS clusters using regression analysis.
Do graduate outcomes improve from six months to two years post-graduation?
We examine whether or not graduate outcomes improve over time, and if graduate outcomes progress differently for different FOS. We take a closer look at this by pooling the five years of data and comparing graduate outcomes at six months and two years. We calculate the absolute and percentage change in graduate earnings for all graduates and by the six FOS.
Indicator 1: Graduation
Graduation rates – trends
Graduation rates vary by field of study and enrolment year
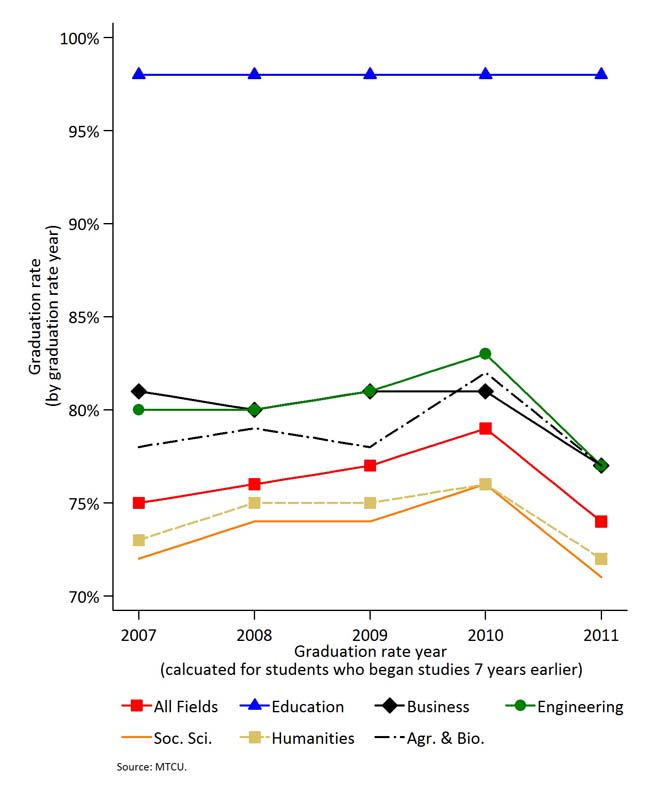
Figure 25 presents time series of graduation rates for all students across six the FOS and for graduates as a whole. Graduation rates are presented as the percentage of students enrolled in a given year who have graduated within seven years of program start.
As illustrated in Figure 25, graduation rates are by far the highest for students in Education programs. Graduation rates are also relatively high for Engineering and Business. Graduation rates are notably lower for students in Humanities programs and Social Sciences programs.
The gap between the graduation rates of these two groups of programs has remained relatively stable over time, though a pattern of higher graduation rates for Engineering and Business students compared to Agricultural and Biological Sciences students disappeared by 2003. Overall, graduation rates increased for students starting their programs from 2000 to 2003, the year that students from the double cohort started their programs. Graduation rates dropped sharply for students starting their programs in 2004 across all FOS when compared to graduates starting in 2003.
Figure 25: Ontario university graduation rates seven years after program start, for all graduates and six FOS clusters, Ministry of Training, Colleges and Universities, 2007-2011
Indicator 2: Earnings
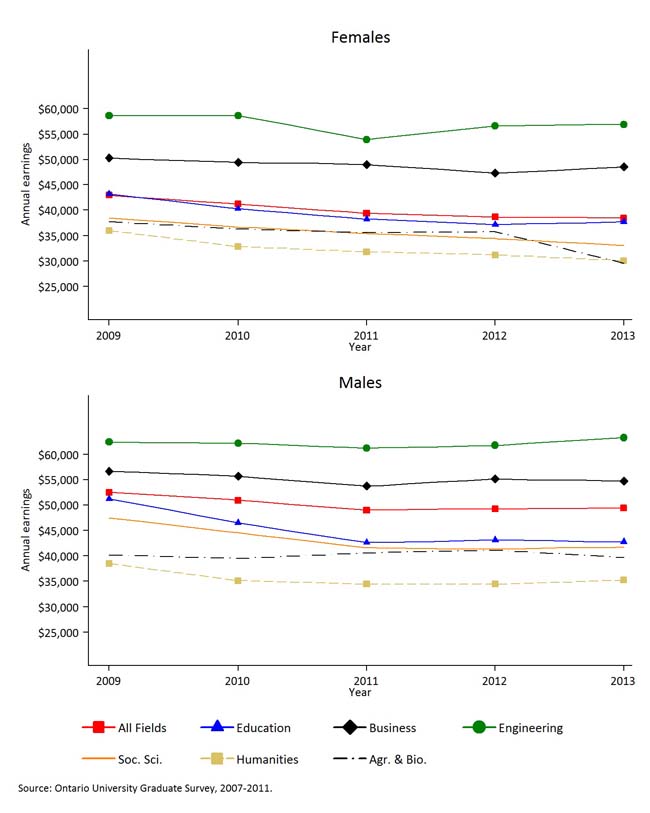
Figures 26 and 27 present mean earnings six months (Figure 26) and two years (Figure 27) post-graduation for graduates from the 2007-2011 period by gender, for all graduates, and for the six major FOS. Earnings are self-reported gross earnings in October of the year the survey is administered and retrospective to 6 months post-graduation. Earnings are adjusted for inflation using the Ontario CPI, indexed at 2010=100.
Note that since OUGS earnings data is reported in $10,000 ranges, we could not use the OUGS earnings responses to calculate mean earnings. Instead we relied on data from the NHS. See Box 4 for a description of our approach.
Graduates report their annual earnings in the OUGS by selecting from a list of 11 earnings ranges. We used the NHS to estimate the mean earnings of OUGS graduates in each category. We limited the NHS sample to respondents who had a bachelor's degree granted by an Ontario university as their highest educational credential, were aged 20-29, and were not enrolled in school the prior year. We then calculated the mean earnings for each age range and used it for all graduates selecting the relevant category in the OUGS. The table below presents the mean earnings for each category:
| Category | Earnings range in OUGS | Estimated mean earning for category (NHS) |
|---|---|---|
| 1 | $0 - $10,000 | $5,624 |
| 2 | $10,001 - $20,000 | $15,307 |
| 3 | $20,001 - $30,000 | $26,671 |
| 4 | $30,001 - $40,000 | $35,713 |
| 5 | $40,001 - $50,000 | $45,630 |
| 6 | $50,001 - $60,000 | $55,702 |
| 7 | $60,001 - $70,000 | $65,032 |
| 8 | $70,001 - $80,000 | $74,718 |
| 9 | $80,001 - $90,000 | $85,122 |
| 10 | $90,001 - $100,000 | $96,056 |
| 11 | Over $100,000 | $163,911 |
Note that while the estimate for Category 11 appears to be very high for graduates only 6 months out of university, we get very similar values for age 20-24, 25-29, and 30-34. Thereafter, mean values for the top category increase considerably.
Degree graduates have strong earnings but earnings vary by field of study
Degree graduates have strong earnings but earnings vary considerably across FOS. Graduates from Engineering and Business programs have higher mean earnings than graduates for all FOS combined, and their higher earnings persist at two years post-graduation.
- Mean earnings of graduates from Social Sciences, Humanities, and Agriculture & Biology programs are lower than for all degree graduates. The earnings gap appears to persist at two years post-graduation.
- The earnings differences across FOS are consistent with recent literature on the returns to degree education in Canada more broadly, which indicated lower returns on investment for Biology and Humanities, somewhat higher returns to Education programs, and significant returns to Engineering programs (Tal & Enenajor, 2013).
Graduates' earnings declined slightly from 2007 to 2011
Figures 26 and 27 suggest a gradual decline in earnings for degree graduates between 2007 and 2011, which is observed for males and females at both six months and two years post-graduation.
Female Engineering graduates in 2009 experienced a substantial decline in earnings six months after graduation, but earnings of more recent graduates have rebounded. Earnings of male graduates from Agriculture and Biology programs increased in 2009, while female graduates experienced a noticeable decline in earnings in 2011.
At the beginning of the time series, Earnings of education graduates were nearly identical to the mean earnings for all FOS; however, earnings of Education graduates fell more sharply, so that by the end of the time series Education graduates earned slightly less than the mean earnings for all graduates. This pattern holds for earnings at six months and two years post-graduation.
As discussed in the college outcomes section, it is important to understand these trends in the context of short-term business cycle effects. Our survey sample only covers graduates from 2007 to 2011, coinciding with the global financial crisis and subsequent recession. The decline in earnings among degree graduates noted here is consistent with the broader decline in earnings across the labour force (not just for recent graduates).
Figure 26: Mean earnings six months after graduation for all graduates and six FOS, by gender, OUGS, 2007-2011
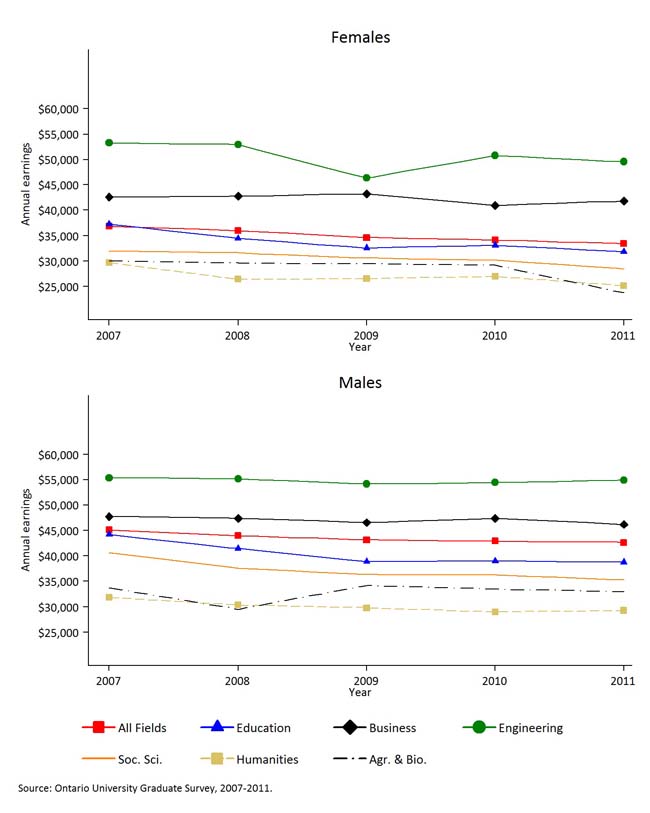
Figure 27: Mean annual earnings, two years after graduation for all graduates and six FOS, by gender, OUGS, 2007-2011
Graduates of both genders in all FOS experience earnings gains over time
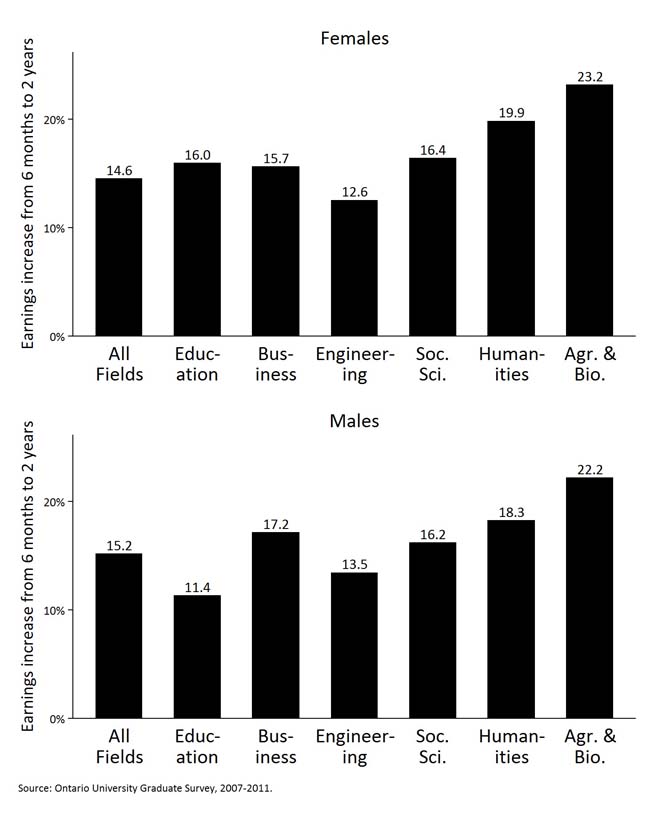
Figure 28 depicts the percentage change in graduate earnings from six months post-graduation to two years post-graduation, while Table 7 presents the absolute change in earnings of graduates from six months to two years post-graduation. Data are pooled for all survey years. Earnings differences are calculated by pooling all employed graduates at six months and two years post-graduation (i.e., not by summing differences in earnings for individual graduates employed at both times). Changes from six months to two years are treated similarly for the other outcomes analyzed in this section.
In absolute terms, female and male graduates experience mean earnings gains of $5,087 and $6,608 from six months to two years post-graduation, respectively (Table 7). In percentage terms, female and male graduates from Humanities and Agriculture & Biological Science programs make above average gains over their first two years post-graduation (Figure 28).
However, the faster pace in earnings increases for graduates from these FOS is not enough to close the earnings gap with graduates from FOS with higher initial earnings, who also experienced earnings gains between six months and two years post-graduation. As a result, the differences in earnings across FOS observed at six months post-graduation stays constant or even increases marginally by two years post-graduation.
Because we only have data up to the two year mark, we do not know whether the larger percent gains for programs with lower initial earnings persist past the two-year mark. If earnings do continue to grow at a similar pace, graduates from Social Sciences, Humanities, and Agriculture and Biological sciences would eventually close the gap that exists between them and graduates of other programs.
| (A) Females | (B) Males | |||||
(1) |
(2) |
(3) |
(4) |
(5) |
(6) |
|
|---|---|---|---|---|---|---|
All programs |
$34,913 |
$40,000 |
$5,087 |
$43,453 |
$50,060 |
$6,608 |
Education |
$33,744 |
$39,137 |
$5,393 |
$40,163 |
$44,732 |
$4,569 |
Business & Commerce |
$42,221 |
$48,831 |
$6,609 |
$47,028 |
$55,103 |
$8,075 |
Engineering |
$50,525 |
$56,868 |
$6,343 |
$54,773 |
$62,156 |
$7,383 |
Social Sciences |
$30,484 |
$35,488 |
$5,003 |
$37,003 |
$43,008 |
$6,006 |
Humanities |
$26,930 |
$32,283 |
$5,353 |
$29,940 |
$35,421 |
$5,480 |
Agriculture & Biological Science |
$28,408 |
$34,993 |
$6,584 |
$32,971 |
$40,302 |
$7,332 |
Figure 28: Changes in graduates’ earnings from six months to two years post-graduation, for all graduates and six FOS, by gender, OUGS, 2007-2011 (pooled)
Outcomes improve as graduates have more time in the labour force, but the extent to which graduates ‘catch up' varies by field of study
Figure 29 presents earnings data across age groups for university graduates from the Labour Force Survey (LFS). Earnings outcomes for university graduates improve substantially as they gain labour market experience. For female university graduates, earnings are 62% higher between the 22-24 and 27-29 age groups. For male university graduates, earnings increase by 66% between the same two age groups.
Using data from the NHS, Figure 30 shows earnings for three FOS with lower mean earnings: Humanities, Social Sciences, and Physical and Life Sciences. For each age group, earnings for graduates in these FOS are calculated as a percentage of the earnings of all university graduates in their age group and gender. For example, female Humanities graduates earn 70.0% as much as graduates overall when they are age 20-24; but earn 83.7% as much as the average of similarly aged graduates when they are 25-29. So they have “caught up” somewhat, but not completely.
In contrast, while Social Science graduates earn less than average after graduation, they do catch up over time. Similarly, graduates in the Sciences make far less than average after graduation, but eventually catch up, and for female graduates, exceed the average. Changes across age groups could be related to across cohort differences in the composition of students getting degrees in different FOS, but our results are similar to longitudinal results recently presented by Ross Finnie using University of Ottawa graduates' earnings from taxfiler data (Education Policy Research Initiative, 2014). His presentation noted that Social Science and Natural Science graduates' earnings increased fairly rapidly in the 15 years since graduation. Humanities graduates' earnings increased more slowly and were below Social Science graduates' earnings 15 years after graduation.
Lifetime earnings vary widely across credential level and field of study, but all PSE graduates have higher lifetime earnings than high school graduates
Education's effects can also be understood in terms of lifetime earnings, conventionally measured as the total earnings over the course of one's working life.
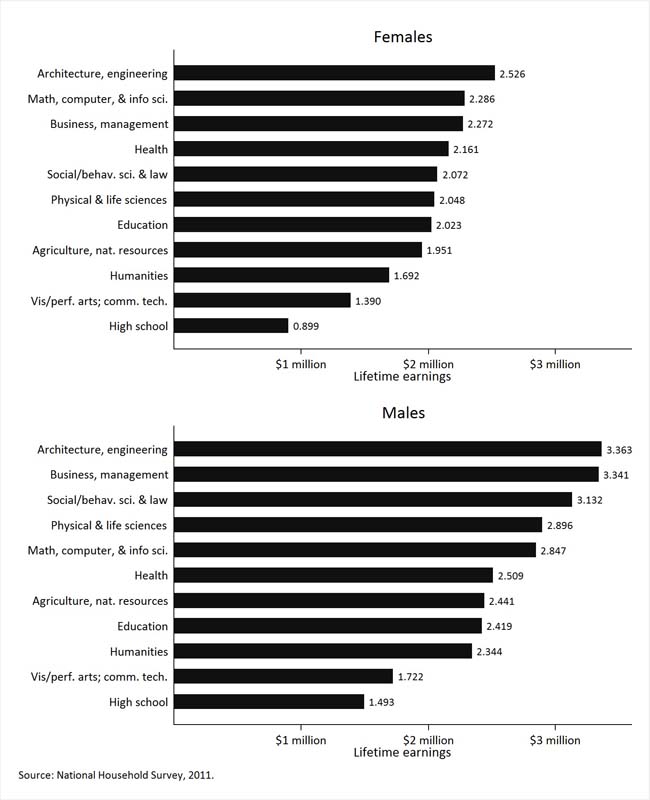
As detailed in Section I of this chapter, most lifetime earnings research uses “synthetic” lifetime earnings, which are constructed by summing the mean earnings of people with the same characteristics who are at different ages. Using the 2011 NHS, we calculated lifetime earnings for ages 25-64, by the credential levels and fields of study available in the NHS. Recall that synthetic lifetime earnings are not expected to accurately forecast recent graduates' lifetime earnings, which could differ substantially from past graduates. But they provide a useful summary measure of labour-market outcomes and a foundation upon which such forecasts could be based.
Figure 31 shows that lifetime earnings vary widely across credential level and FOS, but graduates of all FOS in the NHS have higher lifetime earnings than high school graduates of the same gender. Note that results for Personal/Protective/Transport occupations are not shown for females due to small sample size.
Figure 29: Mean earnings in Ontario by age group, educational attainment and gender, LFS, 2009-2013 (pooled
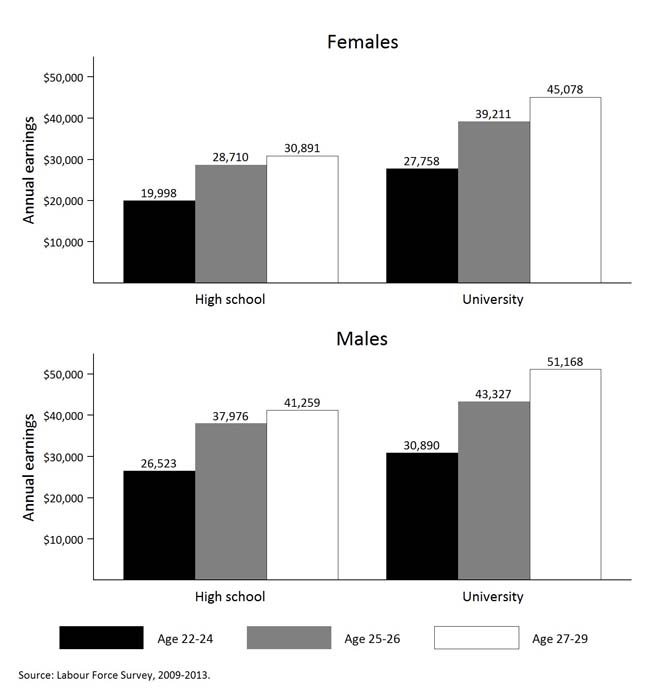
Figure 30: Percentage of overall average Ontario university graduate earnings earned by graduates in selected (low earning) fields of study, NHS, 2011
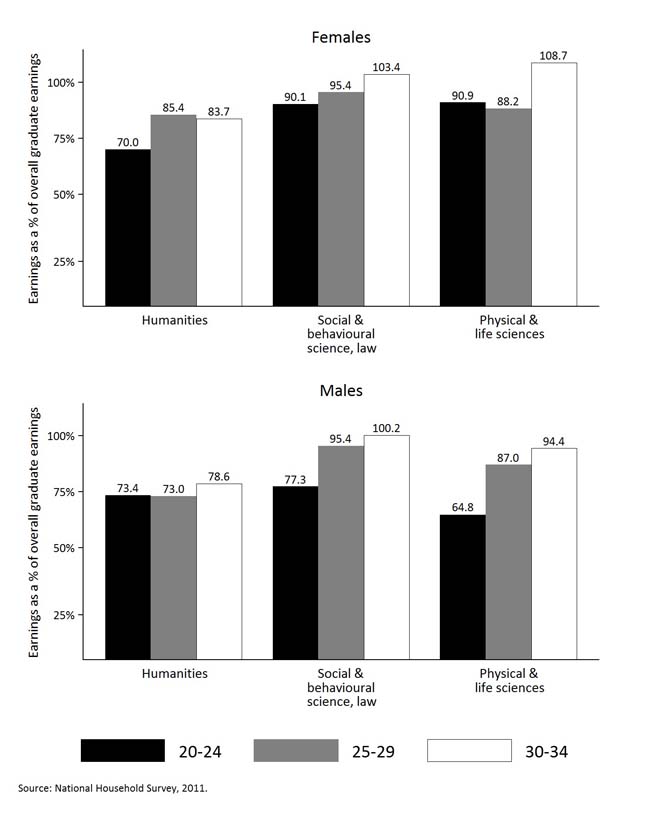
Figure 31: Synthetic lifetime earnings of Ontario university graduates, NHS, 2011
Indicator 3: Unemployment
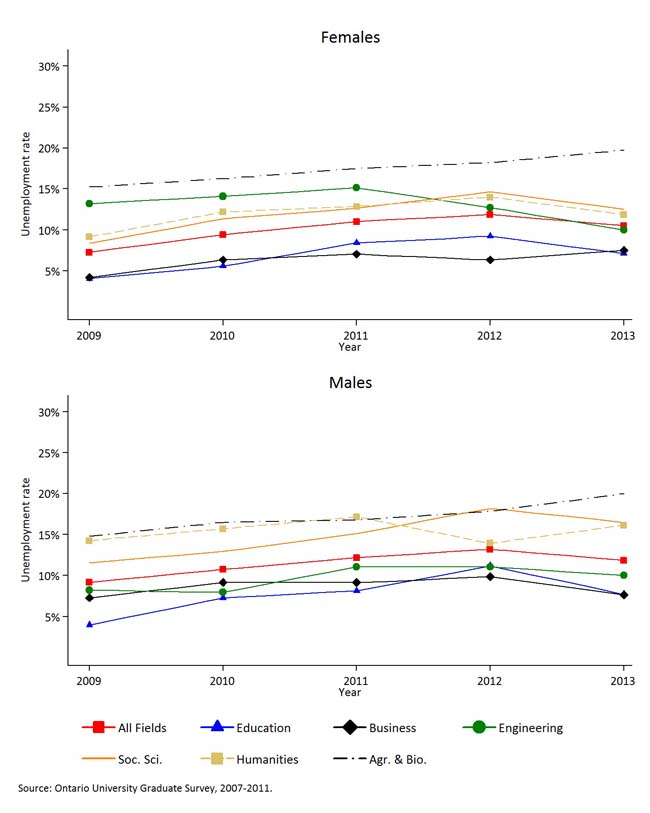
Figures 32 and 33 present unemployment rates six months (Figure 32) and two years (Figure 33) after graduation for graduates from the years 2007-2011 by gender, for all graduates, and for the six major FOS. The unemployment rate is defined here as the number of not-employed graduates who are actively seeking jobs, divided by that same number plus the number of employed graduates. Caution should be taken in interpreting OUGS unemployment data, due to the previously mentioned survey issues, which likely cause overestimates of graduate unemployment rates.
Unemployment increased immediately following the recession and remains at recession-levels
Figure 32 shows the impact of the business cycle on graduate unemployment. Unemployment rates for graduates six months after graduation increased substantially from 2007 to 2009 and appear to stabilize in 2010 and 2011. Unemployment rates two years after graduation (Figure 33) show a more muted increase, likely in part because the time series begins in 2009, after the most intense period of economic contraction that characterized the recession had already occurred.
Despite higher unemployment rates six months after graduation, stable unemployment rates two years after graduation suggest most graduates find jobs
A comparison of Figures 32 and 33 shows that in the 2007 data, the unemployment rates at six months and two years for all FOS together were only a few percentage points apart. The gap widens considerably over time, caused by large increases in unemployment rates for graduates six months after graduation over the period observed. It appears, however, that this increase is only temporary, as unemployment rates for graduates two years after graduation increased only slightly from 2009 to 2013. This suggests that graduates took longer to find jobs, but still found them.
Unemployment rates vary considerably by field of study
Unemployment rates for graduates of Business and Education programs are below the average for all FOS at six months and two years after graduation. Graduates from Social Sciences, and Agriculture and Biological Sciences have higher than average unemployment rates. Graduates from Humanities programs tend to have unemployment rates very close to the overall average, while graduates of Engineering programs have unemployment rates that vary around the average over time, with female Engineering graduates showing very high unemployment rates before 2010 only to have the lowest unemployment rate among fields by 2011.
Figure 32: Unemployment, six months after graduation for all graduates and six FOS, by gender, OUGS, 2007-2011
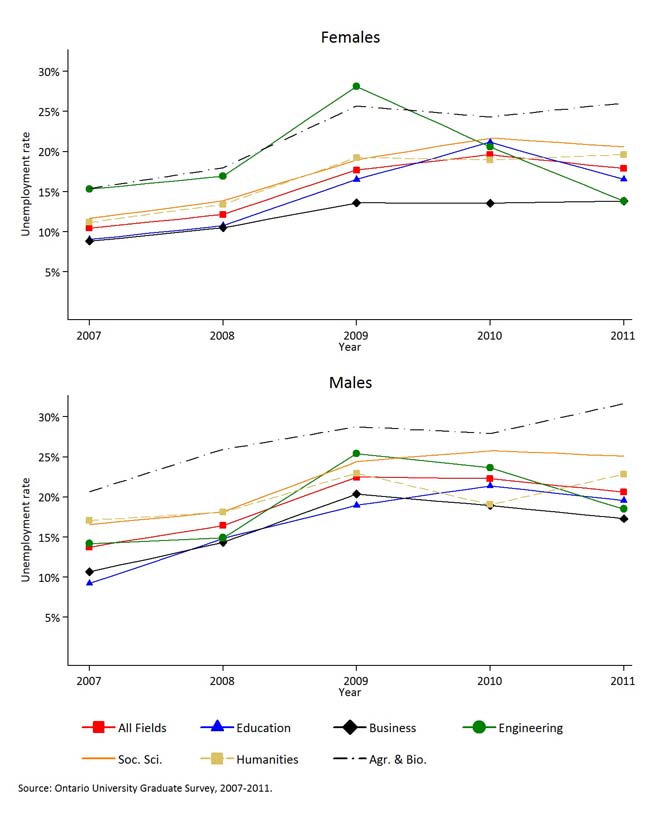
Figure 33: Unemployment, two years after graduation for all graduates and six FOS, by gender, OUGS, 2007-2011
Unemployment rates decrease over time across fields of study, but large gaps remain between fields of study two years after graduation
Table 8 below presents the unemployment rates of graduates at six months after graduation, two years after graduation, and the difference between the two. Panel A presents results for female graduates, and Panel B presents results for male graduates.
Looking at column 3 in Panel A, Female graduates in Social Sciences, Humanities, and Agriculture and Biological Sciences have below-average declines in unemployment over the six-month to two-year period. The exception to this rule is female Engineering graduates, who have a high unemployment rate at six months which declines more than average over the two year period. This means that the differences between the graduate unemployment rates across FOS observed at six months widened for most FOS from six months to two years after graduation.
Looking at column 6 in Panel B, the unemployment rates for male graduates also tend to diverge over time. Graduates from Education, Engineering and Agriculture and Biological Sciences demonstrate above average declines in unemployment, but unemployment rates for graduates from Social Sciences and Humanities are below the average for all graduates two years after graduation, leaving a large gap between these FOS compared to Engineering, Business and Education.
| (A) Females | (B) Males | |||||
(1) |
(2) |
(3) |
(4) |
(5) |
(6) |
|
|---|---|---|---|---|---|---|
All programs |
16.0% |
10.2% |
-5.8% |
19.6% |
11.6% |
-8.0% |
Education |
15.3% |
7.1% |
-8.2% |
17.6% |
8.0% |
-9.6% |
Business & Commerce |
12.2% |
6.4% |
-5.9% |
16.7% |
8.6% |
-8.0% |
Engineering |
18.8% |
12.9% |
-6.0% |
19.8% |
9.8% |
-10.0% |
Social Sciences |
17.8% |
12.1% |
-5.7% |
22.7% |
15.2% |
-7.4% |
Humanities |
16.8% |
12.1% |
-4.7% |
20.2% |
15.5% |
-4.8% |
Agriculture & Biological Science |
22.4% |
17.5% |
-5.0% |
27.7% |
17.4% |
-10.2% |
When do recent graduates' employment prospects begin to improve?
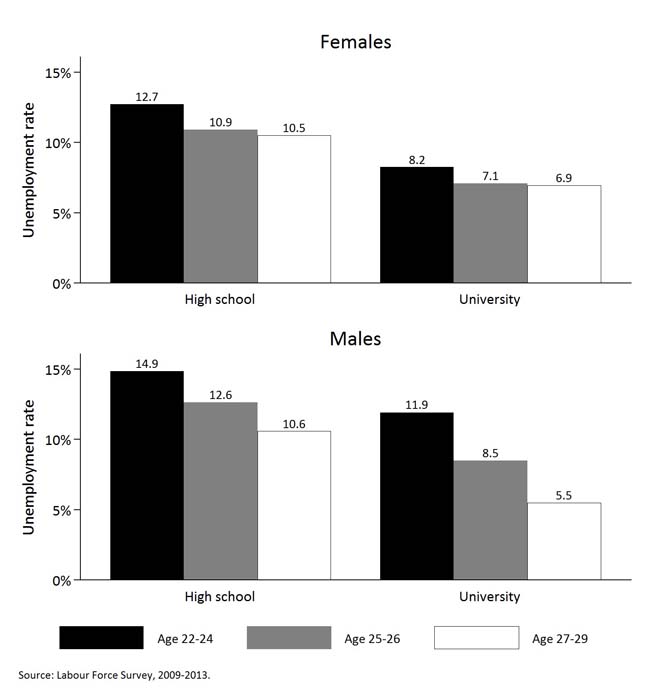
Figure 34 presents unemployment data across age groups for university graduates from the LFS to see if and how much labour-market outcomes improve with age. This demographic largely represents graduates early in their careers who are gaining work experience with age and having more time since graduation to secure employment.
Comparing outcomes across age groups suggests that recent graduates' unemployment rates decline fairly quickly. Female graduate unemployment rates decline from 8.2% at 22-24 to 6.9% at 27-29. Male university unemployment rates decline even more between these two age groups, from 11.9% to 5.5% respectively. While unemployment rates for university graduates aged 22-24 are high, they decline to below the provincial average (which ranges from 9.0% to 7.5% over 2009-2013) for those aged 27-29.
Figure 34: Unemployment rate in Ontario by educational attainment, age group and gender, LFS, 2009-2013 (pooled)
Indicator 4: Labour force participation
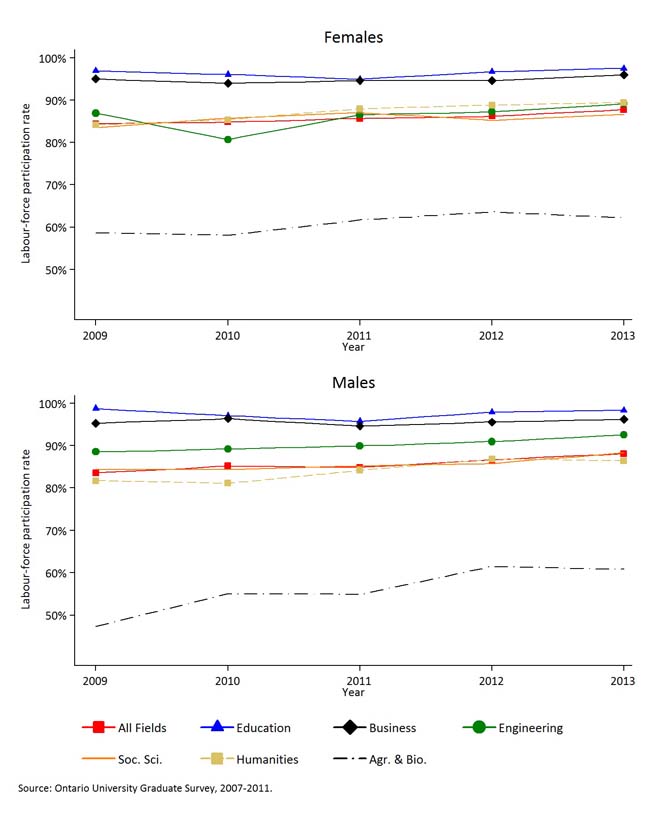
Figures 35 and 36 present labour force participation six months and two-years post-graduation. Labour force participation is defined as the percentage of graduates employed or seeking employment at time of survey and retrospective to six months post-graduation, divided by all graduates.
Labour force participation increased slightly from 2007 to 2011
As Figures 35 and 36 demonstrate, graduates from Business and Education programs have noticeably higher labour force participation rates six months after graduation than graduates from other programs. Their participation rates remain high two years after graduation. Participation rates increase slightly over time across most FOS and at both six months and two years post-graduation. The exception is graduates from Agriculture and Biological Sciences, which had substantial increases in labour force participation over the time series.
Labour force participation rates increase more for females than males two years after graduation, and increases in participation vary considerably by field of study
Table 9 presents the labour force participation rates at six months and two years after graduation, and the difference between the two. Panel A presents results for female graduates, and Panel B presents results for male graduates. Labour force participation increases for graduates in most FOS two years after graduation compared to six months. Labour force participation rates increased 3.5 percentage points for females and 1.4 percentage points for males.
For female graduates, column 3 in Panel A shows large increases in the participation rates of Humanities (8.5 percentage points) and Engineering (5.1 percentage points) graduates. The large increase causes the participation rate for graduates from these FOS to go from below average six months after graduation to above average two years after graduation.
For male graduates, column 6 in Panel B shows a similar trend to the one observed for females. Graduates from Humanities (4.1 percentage points increase), Engineering (4.1 percentage points increase), and to a lesser extent Social Sciences (1.6 percentage points increase) demonstrate above average increases in labour force participation two years after graduation. Male graduates from Agriculture and Biological Sciences show a 4.6 percentage point decline in labour force participation from six months to two years after graduation.
Participation differences may be due to variation in proportion of graduates that return to school
One possible explanation for differences in participation rates across FOS, especially six months after graduation, is that graduates from some FOS might return to education more or less frequently than others. A brief look at the next indicator (return to school) shows that Humanities, Social Sciences, and Agriculture and Biological Science graduates are all much more likely to return to school than graduates from other FOS. Thus, observing participation rates at two years after graduation may not be sufficiently long enough for graduates of some FOS to complete their studies and fully integrate into the labour market.
Figure 35: Labour-force participation rates six months after graduation for all graduates and six FOS, by gender, OUGS, 2007-2011
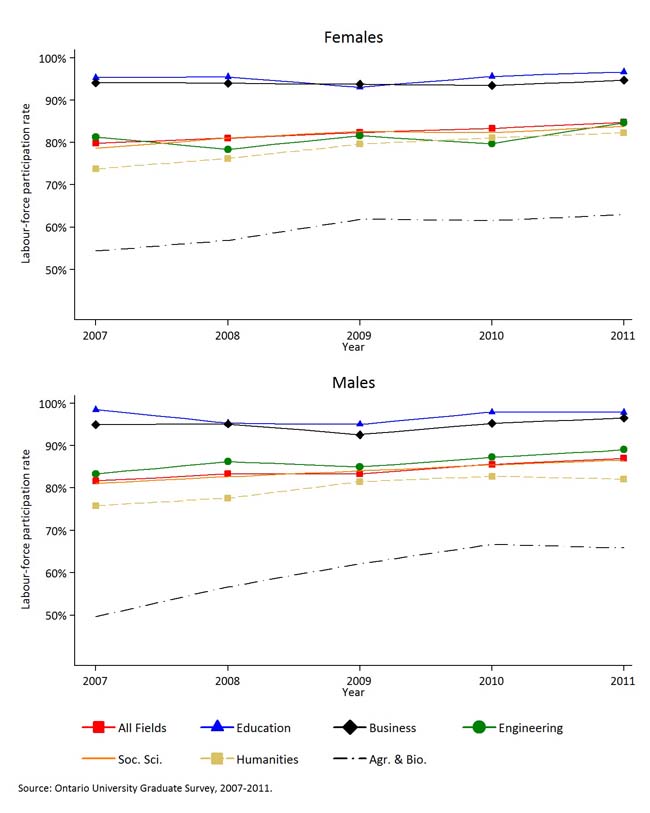
Figure 36: Labour-force participation rates two years after graduation for all graduates and six FOS, by gender, OUGS, 2007-2011
|
(A) Females | (B) Males | ||||
(1) |
(2) |
(3) |
(4) |
(5) |
(6) |
|
|---|---|---|---|---|---|---|
All programs |
82.4% |
85.9% |
3.5% |
84.4% |
85.9% |
1.4% |
Education |
95.2% |
96.4% |
1.2% |
97.0% |
97.6% |
0.6% |
Business & Commerce |
94.0% |
94.9% |
0.9% |
95.0% |
95.6% |
0.7% |
Engineering |
81.3% |
86.4% |
5.1% |
86.4% |
90.4% |
4.1% |
Social Sciences |
81.8% |
85.7% |
3.9% |
84.3% |
85.8% |
1.6% |
Humanities |
78.8% |
87.3% |
8.5% |
80.2% |
84.3% |
4.1% |
Agriculture & Biological Science |
59.8% |
61.1% |
1.3% |
61.0% |
56.4% |
-4.6% |
Indicator 5: Returned to school
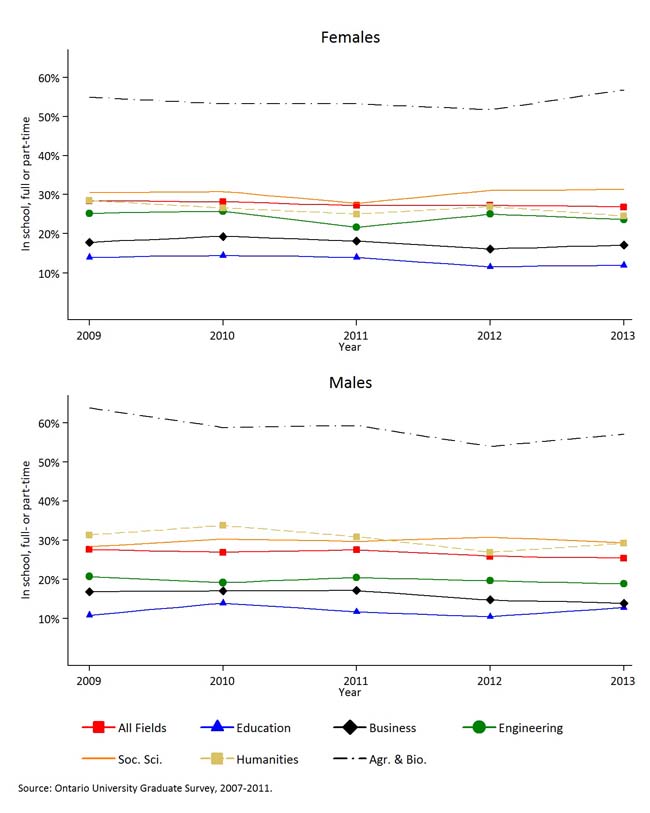
Next we present the percentage of graduates who returned to school six months (Figure 37) and two years (Figure 38) after graduation from the years 2007-2011, by gender, for all graduates, and for the six major FOS. Returning to school is defined here as being enrolled in post-secondary education, either part- or full-time.
The percentage of graduates that return to school varies considerably by field of study
Graduates from Humanities, Social Sciences, and Agriculture and Biological Sciences are more likely to return to postsecondary education six months after graduation than graduates from other FOS. The gap between these FOS and the average for all FOS is smaller two years after graduation; however, the gap remains large for graduates from Agriculture and Biological Sciences.
Graduates in Education, Business, and Engineering are less likely to return to school than the average for all FOS.
The percentage of students who return to school six months or two years after graduation is generally stable over time. The exception is male graduates from Agriculture and Biological Sciences, who show a significant decline in the percentage returning to school.
The percentage of Humanities graduates attending school declines from six months to two years after graduation
Table 10 below presents the percentage of graduates that are attending an educational institution at six months after graduation, two years after graduation, and the difference between the two. Panel A presents results for female graduates, and Panel B presents results for male graduates. There are two key points:
- First, the percentage of Humanities graduates that are attending postsecondary education declines substantially from six months to two years after graduation. As seen in column 3 of Panel A and column six of Panel B, the percentage of female graduates in Humanities that are attending school drops from 44.0% six months after graduation to 26.3% two years after graduation; the percentage of male graduates in Humanities that are attending school drops from 39.3% six months after graduation to 30.3% two years after graduation.
- Second, the percentage of students in Agriculture and Biological Sciences that are in school is substantially higher than all other FOS study and remains equally as high two years after graduation. We cannot determine from the data why the percentage returning to school is so high, but the high percentage entering university graduate or professional programs, along with responses to several open-ended questions (answered by a small minority of students) suggests that many are pursuing credentials to practice professionally in the health industry.
Figure 37: Percentage of graduates that are attending an educational institution six months after graduation for all graduates and by six FOS, by gender, OUGS, 2007-2011
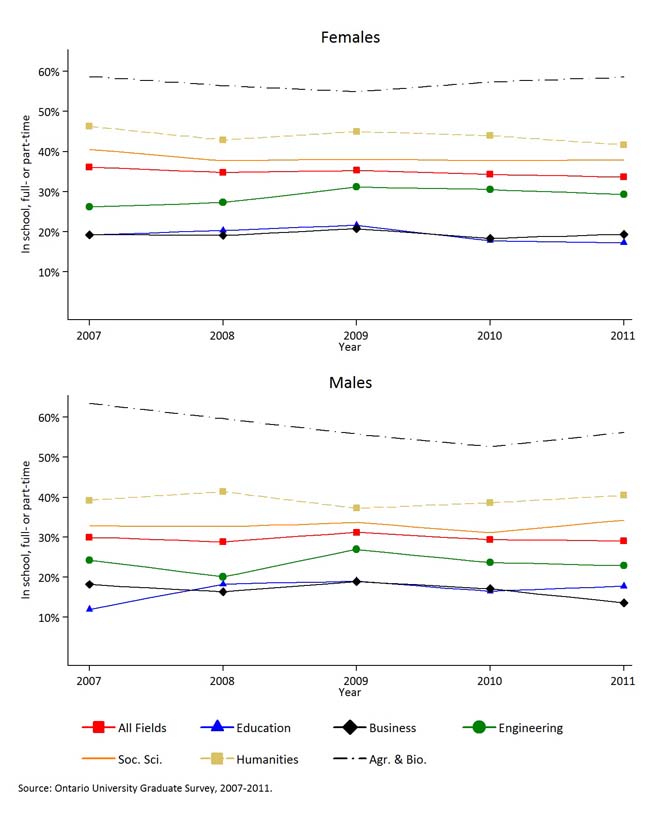
Figure 38: Percentage of graduates that are attending an educational institution two years after graduation for all graduates and by six FOS, by gender, OUGS, 2007-2011
|
(A) Females | (B) Males | ||||
(1) |
(2) |
(3) |
(4) |
(5) |
(6) |
|
|---|---|---|---|---|---|---|
All programs |
34.8% |
27.5% |
-7.3% |
29.7% |
26.6% |
-3.1% |
Education |
19.1% |
13.0% |
-6.1% |
17.0% |
11.9% |
-5.1% |
Business & Commerce |
19.4% |
17.6% |
-1.8% |
16.7% |
15.8% |
-1.0% |
Engineering |
29.0% |
24.2% |
-4.8% |
23.7% |
19.7% |
-4.0% |
Social Sciences |
38.4% |
30.3% |
-8.1% |
33.0% |
29.8% |
-3.2% |
Humanities |
44.0% |
26.3% |
-17.7% |
39.3% |
30.3% |
-9.0% |
Agriculture & Biological Science |
57.2% |
53.9% |
-3.2% |
57.0% |
58.4% |
1.3% |
Indicator 6: Relatedness to employment
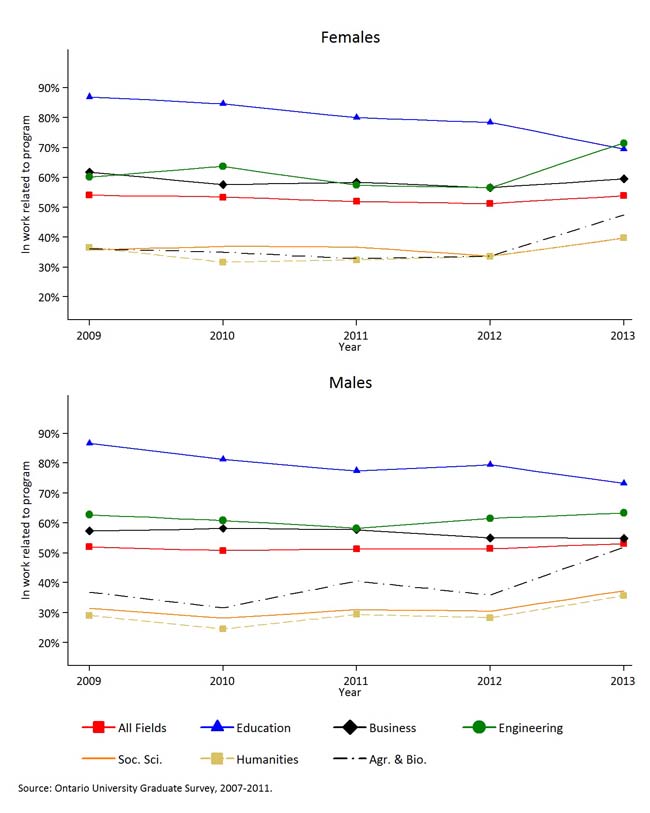
Figures 39 and 40 present the percentage of employed graduates in related work six months (Figure 39) and two years (Figure 40) after graduation for graduates from the years 2007-2011. Related work is defined here as work related to the skills acquired in a program of study. We conceptualize relatedness narrowly, categorizing only graduates who selected “Closely related” as being in related work. (Those selecting “Partially related” are not categorized as being in related work.) The data are presented for females and males separately, for all graduates, as well as for the six major FOS. The way that the OUGS collects information on relatedness changed in 2011, and it seems likely that the changes are responsible for the differences between 2010 and 2011 results.12
Graduates from professional programs are more likely to be employed in related work
Graduates from professional programs (FOS: Business, Education and Engineering) are substantially more likely to be employed in related work than graduates from Humanities, Social sciences and Agriculture and Biological Sciences.
The percentage of Education graduates employed in related work declined over time
The percentage of graduates from the Education FOS employed in related work six months after graduation declined considerably over time. The decline was equally as large for male and female graduates. The decline is not as steep but still apparent when observing Education graduates two years after graduation. We note however that we interpret changes from 2010 to 2011 with caution due to the changes made to the OUGS in 2011 described above.
Differences in employment relatedness by field of study decline over time, but gaps across field of study remain two years after graduation
Table 11 presents the percentage of employed graduates whose work is related to the skills acquired in their program of study at six months after graduation, two years after graduation, and the difference between the two. Panel A presents results for female graduates, and Panel B presents results for male graduates.
As column 3 in Panel A and column 6 in Panel B demonstrate, the percentage of all graduates employed in related work increases over time for all FOS. Female graduates are 7.2 percentage points more likely to be employed in related work two years after graduation compared to six months after graduation; for males the increase is 5.0 percentage points.
Females demonstrate a larger increase in employment relatedness over time than males. This is true for all graduates and for each of the six FOS included in our study. As a result, female graduates are slightly more likely than male graduates to be employed in related work two years after graduation.
The increase in the percentage of female graduates from Education, Humanities, Social Sciences, and Agriculture and Biological Sciences employed in related work from six months to two years after graduation is higher than the increase among Business and Engineering graduates. However, the gaps between FOS are so large that the slight convergence is negligible two years after graduation. It is unclear whether convergence in employment relatedness would continue after two years.
Figure 39: Percentage of employed graduates whose work is related to skills acquired in program of study six months after graduation, for all graduates and six FOS, by gender, OUGS, 2007-2011
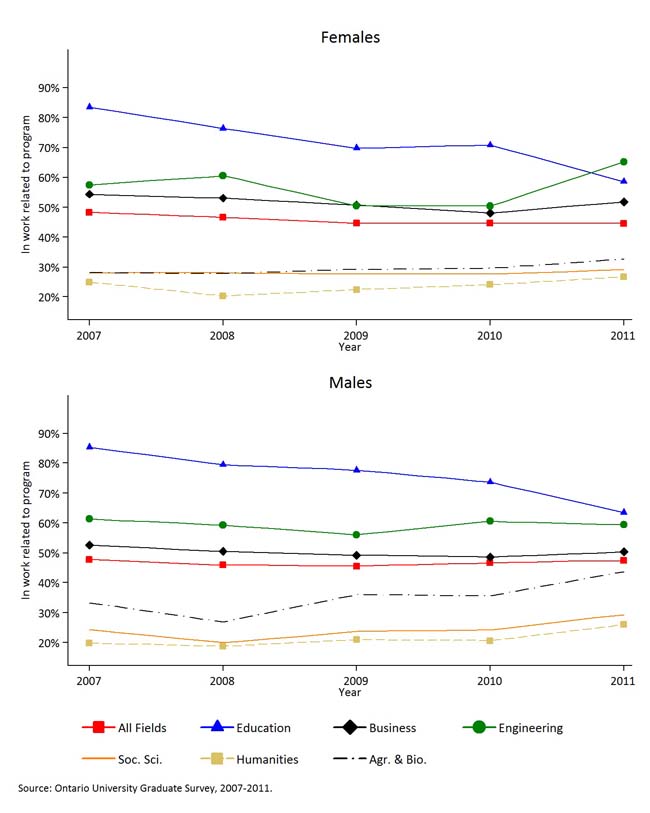
Figure 40: Percentage of employed graduates whose work is related to skills acquired in program of study two years after graduation, for all graduates and six FOS, by gender, OUGS, 2007-2011
|
Female | Males | ||||
(1) |
(2) |
(3) |
(4) |
(5) |
(6) |
|
All programs |
45.7% |
52.9% |
7.2% |
46.7% |
51.7% |
5.0% |
Education |
71.3% |
79.3% |
8.0% |
74.9% |
78.9% |
4.0% |
Business & Commerce |
51.5% |
58.8% |
7.3% |
50.2% |
56.4% |
6.3% |
Engineering |
57.0% |
62.1% |
5.1% |
59.3% |
61.4% |
2.0% |
Social Sciences |
28.1% |
36.6% |
8.4% |
24.6% |
32.0% |
7.4% |
Humanities |
23.8% |
34.9% |
11.1% |
21.3% |
29.6% |
8.3% |
Agriculture & Biological Science |
29.5% |
36.8% |
7.3% |
35.8% |
40.0% |
4.2% |
Summary of outcomes
|
|
|
All programs |
Education |
Business & Commerce |
Engineering |
Social Sciences |
Humanities |
Agriculture & Biological Sciences |
| 1. Grad. rate |
|
|
77% |
98% |
77% |
77% |
71% |
72% |
77% |
| 2. Annual earnings | Female |
6 months |
$33,424 |
$31,832 |
$41,814 |
$49,532 |
$28,469 |
$25,196 |
$23,715 |
Female |
2 years |
$38,443 |
$37,709 |
$48,558 |
$56,910 |
$33,057 |
$30,076 |
$29,579 |
|
Male |
6 months |
$42,654 |
$38,753 |
$46,199 |
$54,878 |
$35,269 |
$29,240 |
$32,951 |
|
Male |
2 years |
$49,419 |
$42,760 |
$54,699 |
$63,261 |
$41,760 |
$35,202 |
$39,681 |
|
| 3. Labour-force participation | Female |
6 months |
84.8% |
96.7% |
94.7% |
84.7% |
83.8% |
82.3% |
63.0% |
Female |
2 years |
87.8% |
97.5% |
96.0% |
89.1% |
86.6% |
89.5% |
62.2% |
|
Male |
6 months |
87.0% |
97.9% |
96.6% |
89.1% |
86.6% |
82.1% |
65.8% |
|
Male |
2 years |
88.1% |
98.4% |
96.2% |
92.6% |
88.4% |
86.5% |
60.8% |
|
| 4. Unemployment | Female |
6 months |
17.9% |
16.5% |
13.8% |
13.8% |
20.6% |
19.6% |
26.1% |
Female |
2 years |
10.5% |
7.1% |
7.5% |
10.0% |
12.5% |
11.9% |
19.8% |
|
Male |
6 months |
20.7% |
19.6% |
17.3% |
18.5% |
25.1% |
22.9% |
31.7% |
|
Male |
2 years |
11.9% |
7.7% |
7.6% |
10.0% |
16.5% |
16.2% |
20.0% |
|
| 5. In school | Female |
6 months |
33.7% |
17.2% |
19.4% |
29.2% |
37.9% |
41.7% |
58.6% |
Female |
2 years |
26.9% |
11.9% |
17.1% |
23.7% |
31.4% |
24.6% |
56.8% |
|
Male |
6 months |
29.1% |
17.8% |
13.6% |
22.9% |
34.3% |
40.5% |
56.2% |
|
Male |
2 years |
25.4% |
12.8% |
13.9% |
18.8% |
29.4% |
29.2% |
57.1% |
|
| 6. In work closely related to education | Female |
6 months |
44.6% |
58.6% |
51.8% |
65.2% |
29.1% |
26.7% |
32.7% |
Female |
2 years |
53.9% |
69.5% |
59.5% |
71.5% |
39.7% |
39.8% |
47.5% |
|
Male |
6 months |
47.4% |
63.5% |
50.3% |
59.4% |
29.3% |
26.0% |
43.7% |
|
Male |
2 years |
53.0% |
73.3% |
54.8% |
63.4% |
37.3% |
35.7% |
51.9% |
NOTE: Graduation rates are for the 2004 cohort (calculated in 2011). All other values are from the 2013 OUGS. The 2-year values are for 2013 and the 6-month values based on retrospective questions for the year 2011.
12 Two changes seem important. First, graduates were asked if their jobs were related to the skills they developed in their program in all survey years, but the question wording changed substantially in the 2011 survey to include examples of skills (“…such as critical thinking, analytical communication, and problem solving”). Second, to supplement the question about skills developed in their program, in 2011 a new question was added asking graduates if their jobs were related to the subject matter of their program. The presence of this second question could alter responses to the skills relatedness question that precedes it.


