Chapter 1 – A closer look at student outcomes
Section III – Alignment with student needs: Analysis of the college and university sector
Introduction
In this section we aim to examine the credential mix as a whole to assess the extent to which the mix is achieving positive outcomes for graduates. Our analysis draws mainly on the GOSS, OUGS, and NHS data. We also draw on recent literature.
The data analysis requires accounting for field of study (FOS) across both college and university graduates. However, since the GOSS and OUGS use different program classification approaches, accounting for FOS requires manually mapping college programs to university programs in the same FOS. To make this task manageable, we adopted a case study approach that involved mapping programs and assessing graduate outcomes in two selected FOS: Business and Engineering.
Approach to analysis
We selected Business and Engineering as FOS for analysis because both the college and university sectors offer a breadth of programs and credentials in this field.
Our analysis focuses on four indicators, described in Table 12. For comparability, we considered only outcomes six months after graduation because they are available for both college and university graduates. We also only considered outcomes measured for both college and university graduates, forgoing a comparison on the relatedness of work to education because the college and university questions are so different. See section below for data limitations and other technical notes.
Of particular note, in order to construct a labour force status variable that is consistent across the GOSS and OUGS, we treat everyone in both surveys enrolled in school full time as not being in the labour force, including university graduates who reported being employed. This will lead to lower than expected employment rates for this cohort of individuals.
Limitations and other technical notes
Comparing GOSS and OUGS data – A goal of this analysis was to examine the extent to which the differences in outcomes across credentials are aligned with what one would reasonably expect given differences in time and cost invested, and the learning outcomes expected to be achieved. However, any comparisons made between college credentials and university credentials for this purpose must be interpreted with caution, since the GOSS and OUGS measure labour market activities differently. Also, note that both define labour force participation in a way that is inconsistent with Statistics Canada definition. The key difference is that in the GOSS, when a graduate says that they are enrolled in school full-time six months after graduation, all questions about the labour market are skipped. In other words, they are treated as not in the labour force, even though it is very possible that many have jobs or are seeking part-time employment.1 In contrast, all graduates are asked about their employment in the OUGS, but graduates seeking work are not asked if they seek part- or full-time work, which we would need to know to code the labour force participation of not employed, full-time students the way that Statistics Canada does.
Making a uniform labour force status variable – To construct a labour force status variable that is consistent across the GOSS and OUGS, we treat everyone in both surveys enrolled in school full-time as being not in the labour force, including university graduates who reported being employed. The biggest drawback of this approach is that graduates are asked if they are enrolled full- or part-time only in the 2011 OUGS; previously, they were only asked if they were enrolled, with no distinction made between full- and part-time studies. We thus limit our analysis of the OUGS in this comparative chapter to the 2013 OUGS, meaning the respondents that graduated in 2011. Note that the sample we use for earnings is also affected, and we only compare earnings of graduates who are in the labour force, as defined here (i.e., we exclude university graduates from our earnings analysis if they are full-time students, even if they report earnings). This will increase mean earnings, but it is necessary to make college and university graduates’ earnings comparable.
Timeframe of the analysis – The sample is limited to university graduates who graduated in 2011 but includes college graduates who graduated in the five-year span centered on 2011 to increase the sample size of graduates of college degree programs, who are few in number, especially in Engineering.
Sample size – The GOSS and OUGS are censuses, allowing us to find out how many of each type of graduate there is, including survey non-respondents. To get a sense of the relative number of graduates of each credential, we restrict the counts to graduates who graduated in a single year for both college and university graduates: 2011. Table 13 presents the results. The results highlight the small number of college degree graduates, especially females of Engineering programs. We have more in our college sample than Table 13 suggests because — although our sample includes only respondents — we pool over five years. However, there are still so few female college graduates of Engineering programs at the certificate and degree level that they are excluded from the results.
| Indicator | Measure | Data source | Time of collection |
|---|---|---|---|
| 1. Earnings | Total annual earnings before tax deductions and transfers among employed graduates. Inflation-adjusted with the Consumer Price Index for Ontario. |
OUGS – Self-reported gross earnings at time of survey |
2 years post-graduation, with respondents asked to report earnings for 6 months post-graduation retrospectively |
| GOSS – Self-reported gross earnings at time of survey |
6 months post-graduation | ||
| NHS – Self-reported annual employment earnings in 2010 | 2011 | ||
| 2. Unemployment | Among graduates in the labour force, the percentage who are unemployed |
OUGS – Self-reported employment status at time of survey |
2 years post-graduation, with respondents asked to report employment status for 6 months post-graduation retrospectively |
| GOSS – Self-reported employment status at time of survey |
6 months post-graduation | ||
| NHS – Self-reported employment status May 1-7, 2011 |
2011 | ||
| 3. Labour force participation rate | Among all graduates, the percentage who are either employed or looking for employment | OUGS – Self-report of being either employed or seeking employment at time of survey |
2 years post-graduation, with respondents asked to report labour force status for 6 months post-graduation retrospectively |
| GOSS – Self-report of being either employed or seeking employment at time of survey |
6 months post-graduation | ||
| 4. Returned to education | Among all graduates, the percentage that returned to education within six months of graduation |
OUGS – Self-report of being enrolled in post-secondary education at time of survey |
2 years post-graduation, with respondents asked to report returning to school for 6 months post-graduation retrospectively |
| GOSS – Self-report of being enrolled in post-secondary education at time of survey |
6 months post-graduation |
NOTE: For comparability, we considered only outcomes six months after graduation because they are available for both college and university graduates.
| Business | Engineering | ||||||||
| Credential | Females | Males | Females | Males | |||||
|---|---|---|---|---|---|---|---|---|---|
| Certificate | 1,100 | (7.3%) | 273 | (2.0%) | 13 | (0.8%) | 34 | (0.4%) | |
| Diploma | 4,688 | (31.0%) | 3,590 | (26.6%) | 245 | (16.0%) | 2,250 | (24.9%) | |
| Advanced diploma | 2,192 | (14.5%) | 2,218 | (16.4%) | 345 | (22.5%) | 2,287 | (25.3%) | |
| Degree | 121 | (0.8%) | 146 | (1.1%) | 0 | (0.0%) | 21 | (0.2%) | |
| Graduate certificate | 2,133 | (14.1%) | 1,722 | (12.8%) | 99 | (6.4%) | 279 | (3.1%) | |
| University degree | 4,901 | (32.4%) | 5,548 | (41.1%) | 834 | (54.3%) | 4,174 | (46.1%) | |
Case 1: Business programs
Figure 41 presents GOSS and OUGS earnings data for Business program graduates across college and university credentials six months post-graduation, by gender. Overall, higher earnings are associated with higher college credentials, as previously observed. However, university graduates earn considerably more than college graduates, with female university graduates earning $11,077 more than their counterparts with the highest earning college credential, and male university graduates earning $9,942 more. Also notable is that the earnings difference between female university graduates and female college graduates is larger than the corresponding difference for males in absolute (dollars) and relative (percentage) terms.
Using the same data, Figure 42 presents the marginal return to obtaining each credential. These results mirror the above findings: while each subsequent credential is associated with higher earnings, the largest earnings difference is observed between college and university degrees, and this difference is larger for females than males.
Figure 43 presents NHS earnings data for Business program graduates from two classes of college credential (1-2 year programs and >2 year programs) and university Business degree graduates, for both the 20-34 age range and the 45-59 age range. Once again, for both genders and age ranges, higher earnings are associated with longer college programs, and the earnings of university graduates are considerably higher than the earnings of college graduates. Furthermore, the differences between college and university graduate earnings for males increase as they grow older: for the 20-34 group, male university graduates make 26.4% more than graduates of >2 year college programs, while for the 45-59 group, male university graduates make 49.4% more than their college counterparts. As indicated by Figure 43, the relative earnings gap between female college graduates and university graduates in the 20-34 age group is higher than for males, with female university graduates earning 47.1% more than their college counterparts. However, this gap does not grow with age as drastically as it does for males, with female university graduates aged 45-59 earning 49.2% more than their college counterparts.
Figure 41: Mean annual earnings for college and university Business graduates six months post-graduation by credential and gender, GOSS, 2009-2013 (pooled) and OUGS, 2011
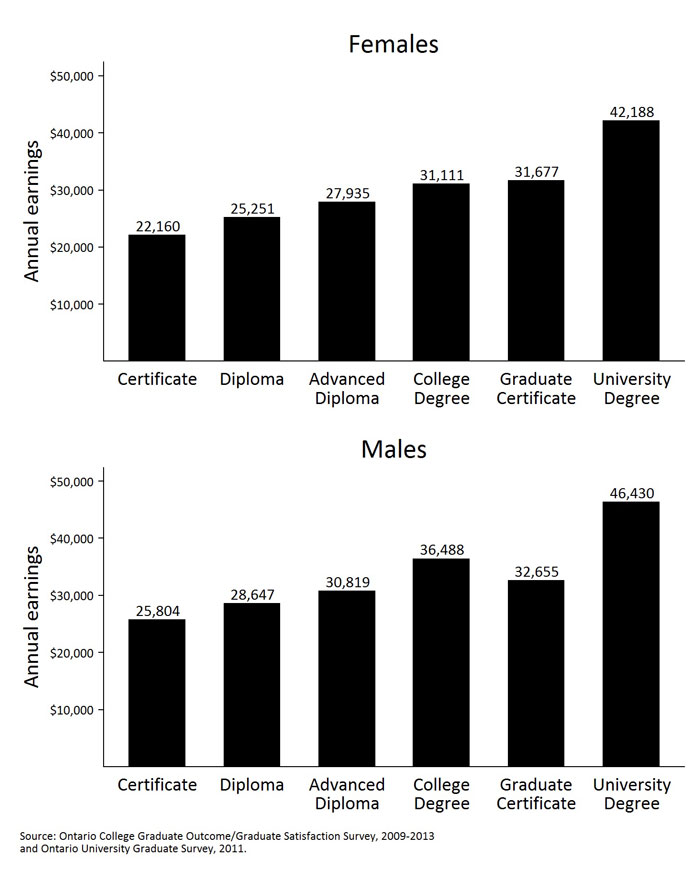
Figure 42: Marginal returns for business graduates six months post-graduation, by gender, GOSS, 2007-2013 (pooled) and OUGS, 2011
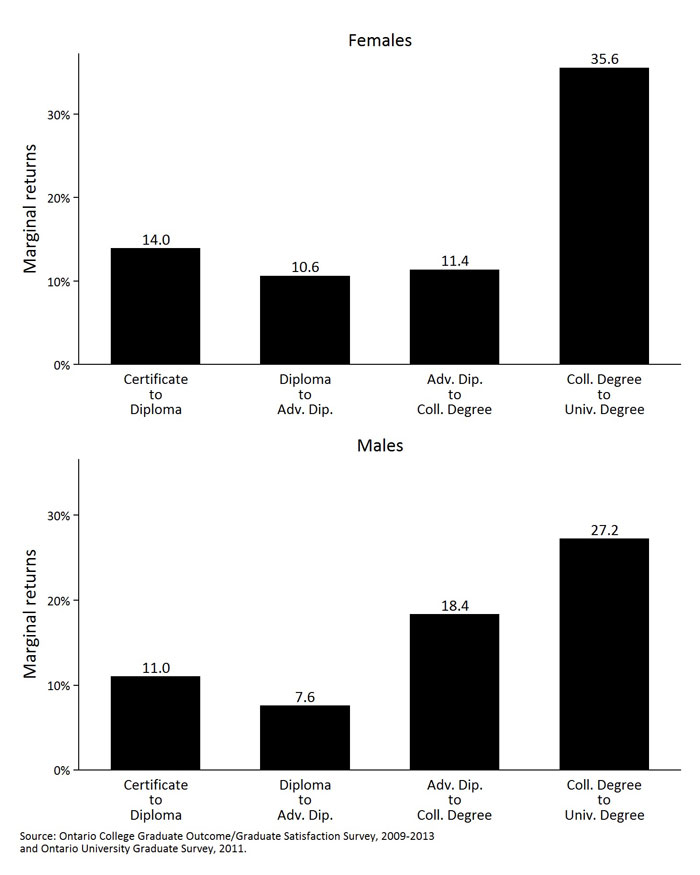
Figure 43: Mean annual earnings of college and university business graduates by program length, age group, and gender, NHS, 2011
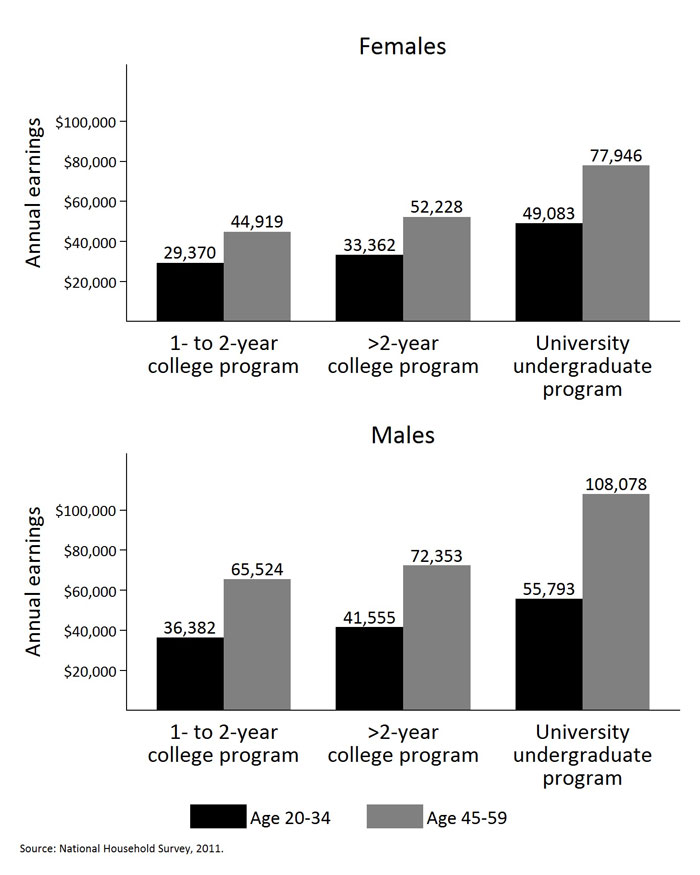
Figure 44 presents GOSS and OUGS unemployment rates for business program graduates across college and university credentials six months post-graduation, by gender. For females, unemployment rates are roughly equal for college and university degree graduates, with higher unemployment rates experienced for graduates of shorter college credentials. For males, college degree graduates experience the lowest rate of unemployment, followed by university graduates and graduates of shorter college credentials.
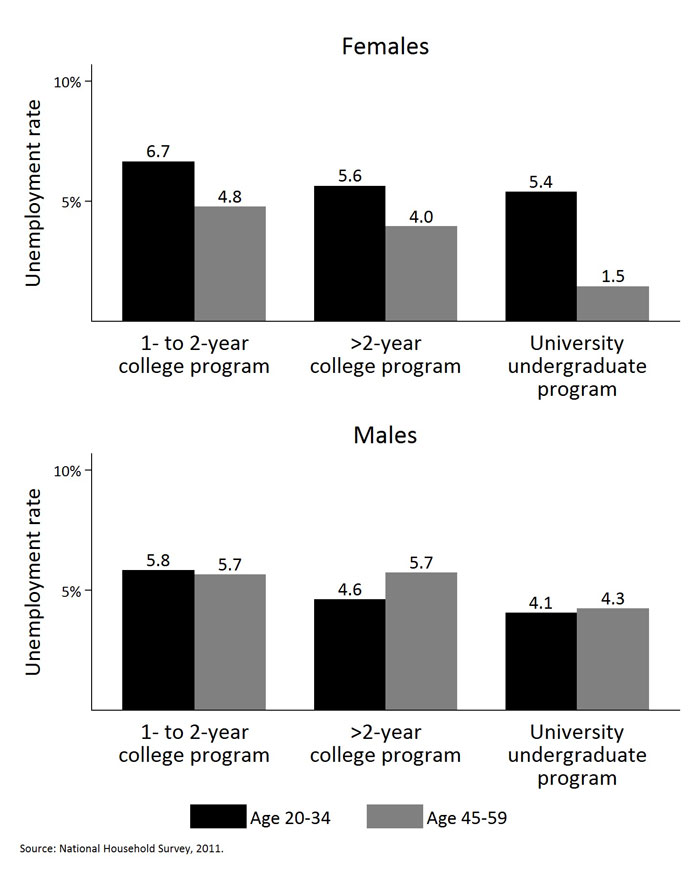
Figure 45 presents NHS unemployment data for Business program graduates from two classes of college credential and university business degree graduates, for both the 20-34 age range and the 45-59 age range. Unemployment rates are generally equal for university graduates and >2 year college program graduates of each gender in the 20-34 age group. However, unemployment rates are considerably lower for university graduates in the 45-59 age group compared to college graduates in the same age group, especially for female graduates.
Note that unemployment rates generated from the GOSS and OUGS must be interpreted with caution since the GOSS and OUGS define labour force participation differently, and both surveys define it in a way that is inconsistent with the Statistics Canada definition (see section on Limitations and Other Technical Notes).
Figure 44: Unemployment rate for college and university business graduates six months post-graduation, by credential type and gender, GOSS, 2009-2013 (pooled) and OUGS, 2011>
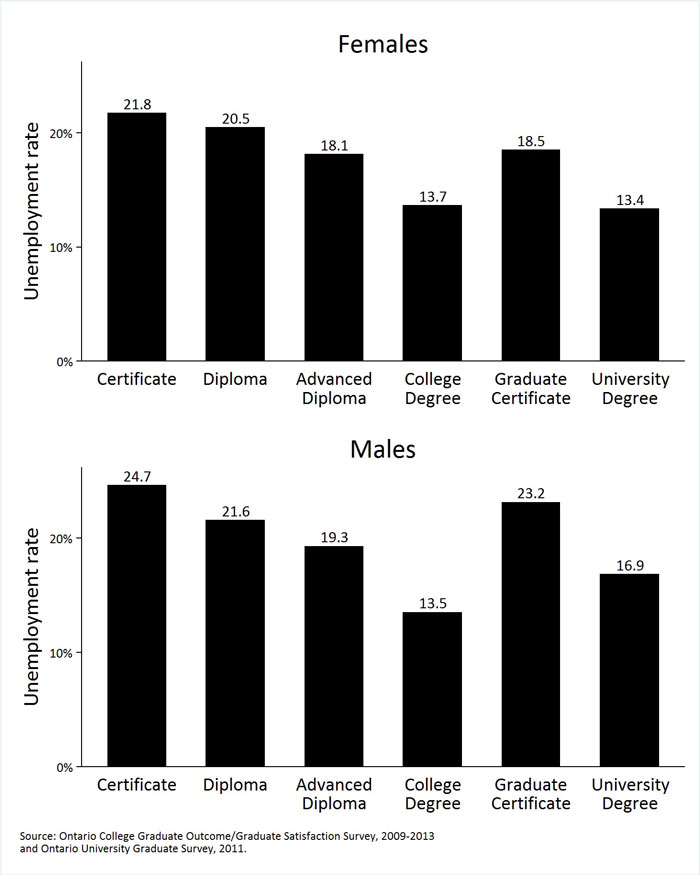
Figure 45: Unemployment rate for college and university business graduates by program length, age group, and gender, NHS, 2011
Indicator 3: Labour force participation
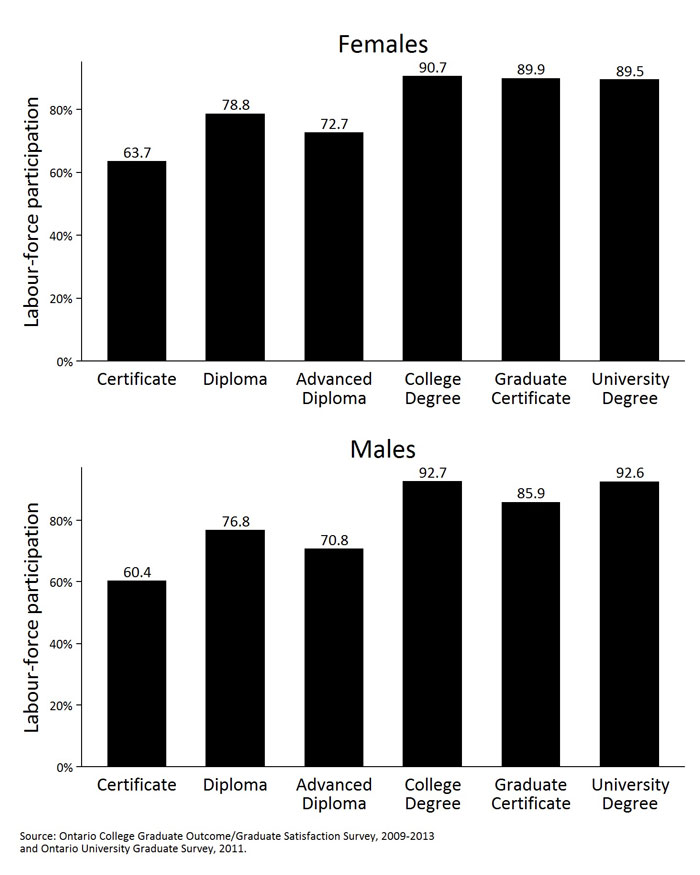
Figure 46 presents GOSS and OUGS labour force participation rates six months post-graduation for Business program graduates, by credential and gender. For both genders, labour force participation rates are essentially equal between college degree and university degree graduates, and lower for graduates of shorter college credentials. For female graduate certificate graduates, labour force participation rates are equivalent to the participation rates for college and university degree graduates, while for male graduate certificate graduates, labour force participation is relatively lower.
Figure 46: Labour force participation rate for college and university business graduates six months post-graduation by credential type and gender, GOSS, 2009-2013 (pooled) and OUGS, 2011
Indicator 4: Returned to school
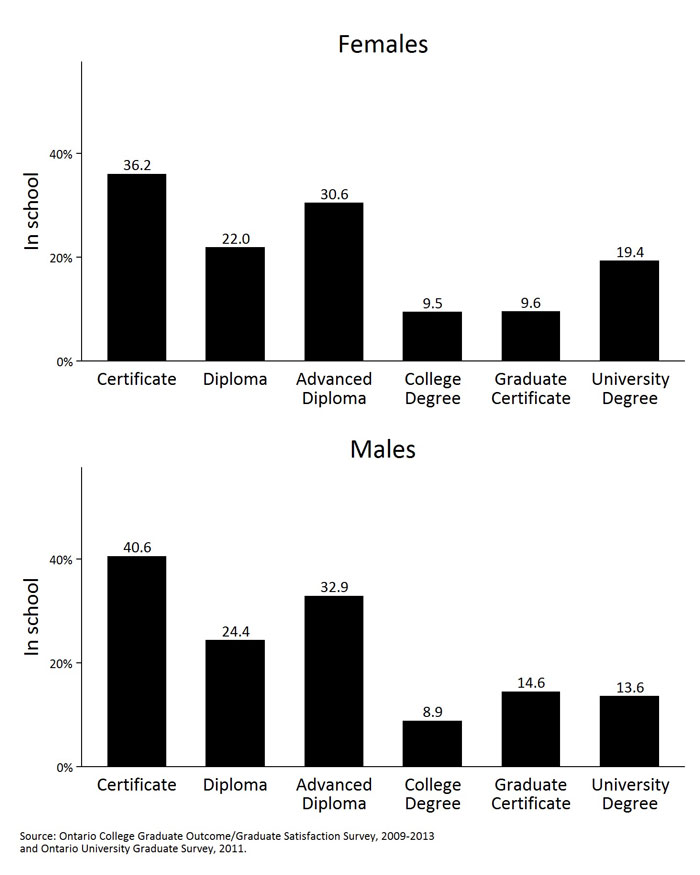
Figure 47 presents GOSS and OUGS rates of returning to school for further education for Business program graduates six months post-graduation, by credential and gender. Across genders, the graduates most likely to return to school are those of certificate programs, followed by advanced diploma and diploma programs, while college degree graduates are the least likely to return to school. For both genders, university degree graduates are more likely to return to school than college degree graduates, but less likely to return than diploma graduates. However, female graduate certificate graduates are much less likely to return to school than university degree graduates, while male graduate certificate graduates are slightly more likely to return to school than university degree graduates.
Figure 47: Percentage of college and university business graduates that return to school within six months of graduation by credential type and gender, GOSS, 2009-2013 (pooled) and OUGS, 2011
Case 2: Engineering programs
Figure 48 presents GOSS and OUGS earnings data for Engineering program graduates six months post-graduation, by credential and gender. Female certificate and college degree data has been excluded due to very low sample size.
Male university degree graduates earn $9,517 more than college degree graduates. While degree data is not available for female Engineering graduates, female university graduate earnings are $16,428 higher than advanced diploma graduate earnings. Unlike Business graduates, Engineering graduate certificate graduates of both genders also appear to earn less than most other credentials, with earnings equivalent to those of diploma graduates for females and certificate graduates for males.
Figure 49 uses this earnings data to present the marginal return to obtaining each credential. Again, most marginal returns for female graduates are not shown due to very low sample size. For male graduates, the largest return is for a university degree over a college degree.
Figure 50 presents NHS earnings data for Engineering program graduates from two classes of college credential (1-2 year programs and >2 year programs) and university Engineering degree graduates, for both the 20-34 age range and the 45-59 age range. Across genders and age ranges, higher earnings are associated with longer college programs, and the earnings of university graduates are considerably higher than the earnings of college graduates. In a pattern similar to that observed for Business graduates, the differences between college and university graduate earnings for males increases with age. In the 20-34 age group, male university graduates make 23.1% more than graduates of >2 year college programs, while in the 45-59 group male university graduates make 47.5% more than male college graduates. Figure 50 also indicates that the relative earnings gap between female college graduates and university graduates in the 20-34 age group is higher than for males, with female university graduates in this age group earning 33.2% more than their college counterparts from >2 year programs, with an equivalent gap of only 23.1% for males. However, this relative gap decreases slightly with age, with female university graduates aged 45-59 earning 31.0% more than their college counterparts.
Figure 48: Mean earnings of college and university engineering graduates six months post-graduation by credential type and gender, GOSS, 2009-2013 (pooled) and OUGS, 2011
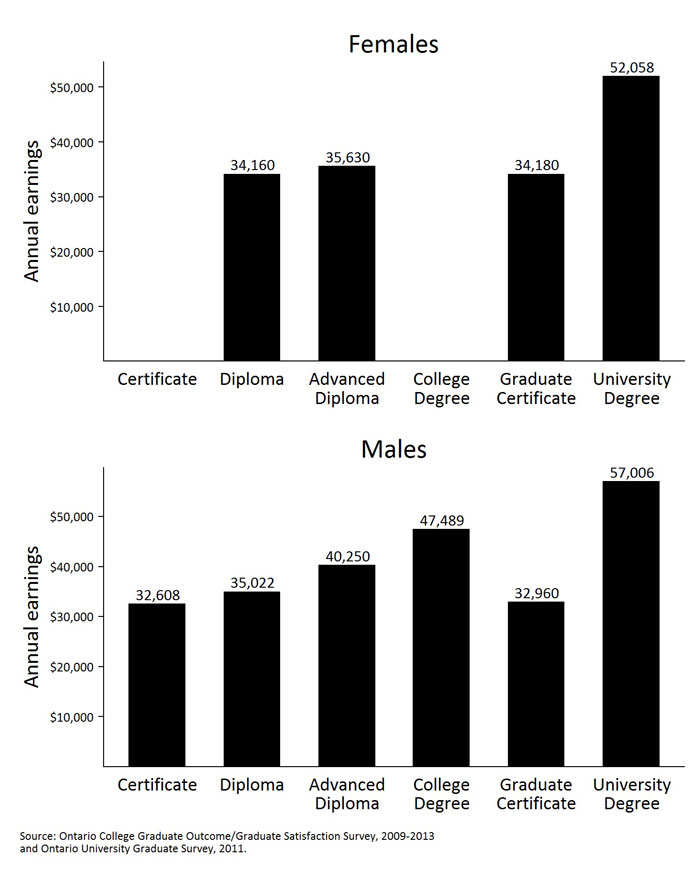
Figure 49: Marginal returns for college and university engineering graduates six months post-graduation by credential and gender, GOSS, 2009-2013 (pooled) and OUGS, 2011
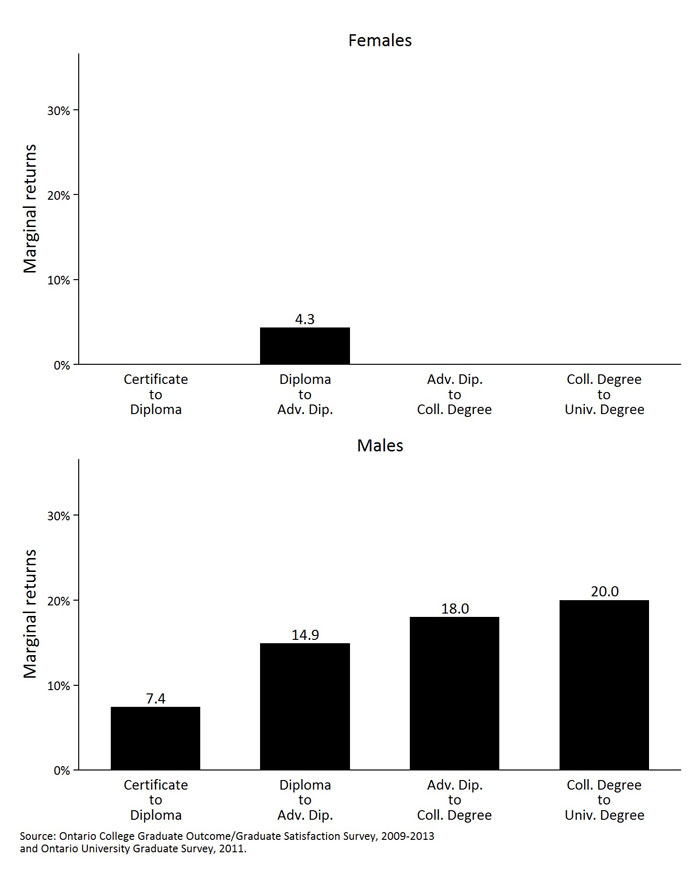
Figure 50: Mean annual earnings for college and university Engineering graduates by program length, age, and gender, NHS, 2011
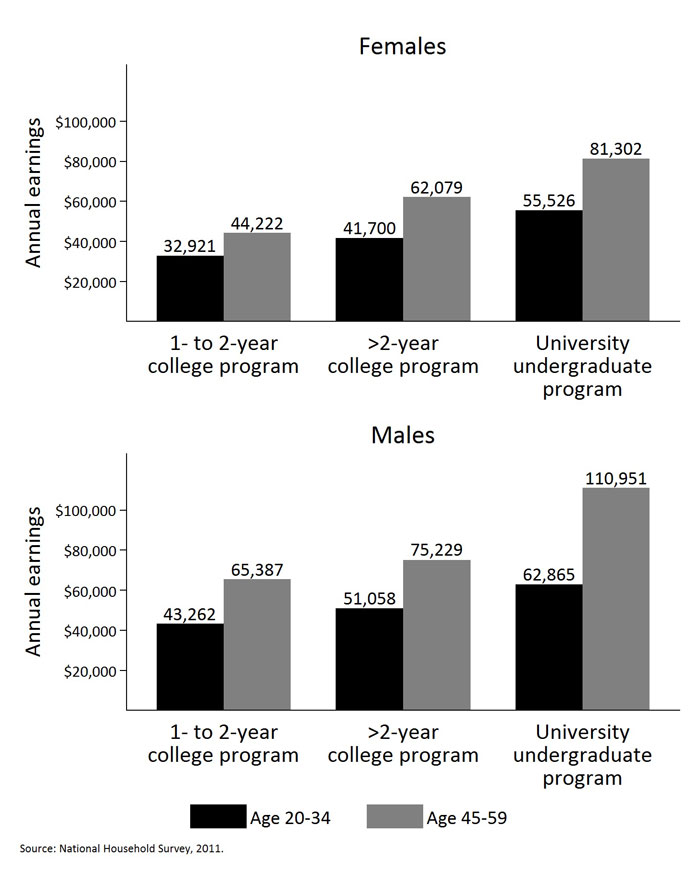
Figure 51 presents GOSS and OUGS unemployment rates for engineering program graduates across college and university credentials, by gender. Again, data for female certificate and college degree graduates is not available due to low sample size.
For females, unemployment rates are the lowest for university graduates compared to diploma, advanced diploma, and graduate certificate graduates. However for males, university degree graduates have lower unemployment rates than only certificate, graduate certificate, and diploma graduates, and higher unemployment rates than advanced diploma and college degree graduates.
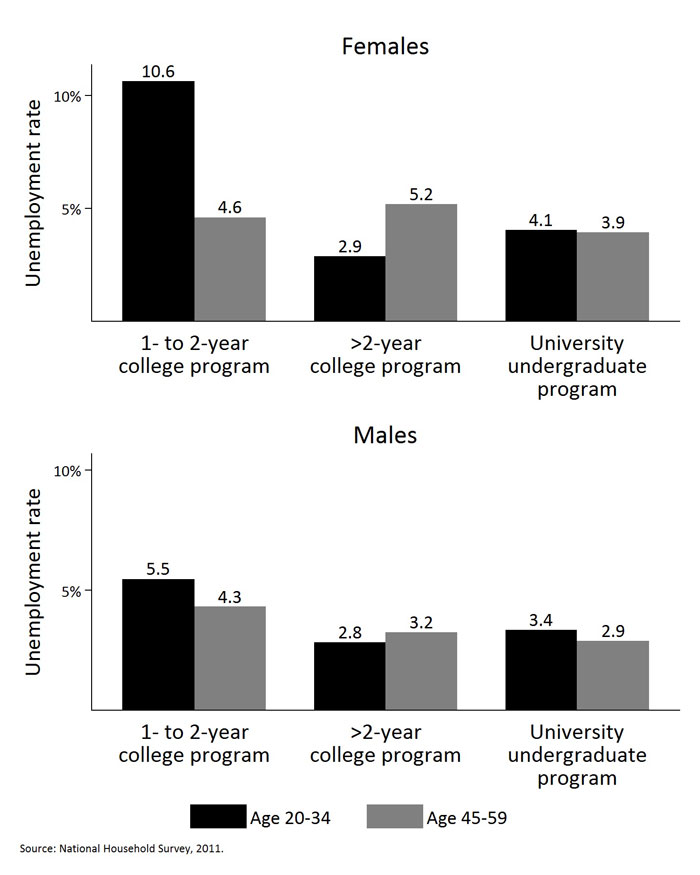
Figure 52 presents NHS unemployment data for Engineering program graduates from two classes of college credential and university engineering degree graduates, for both the 20-34 age range and the 45-59 age range. For the 20-34 age group, unemployment rates are highest for 1-2 year college program graduates across genders, with female graduates from this category facing much higher unemployment than males, followed by university graduates, and graduates of >2 year college programs with the lowest unemployment rate. This pattern is reversed for the 45-59 age group, in which university graduates experience lower unemployment than either category of college graduate across genders.
Figure 51: Unemployment rate for college and university engineering graduates six months post-graduation by credential type and gender, GOSS, 2009-2013 (pooled) and OUGS, 2011
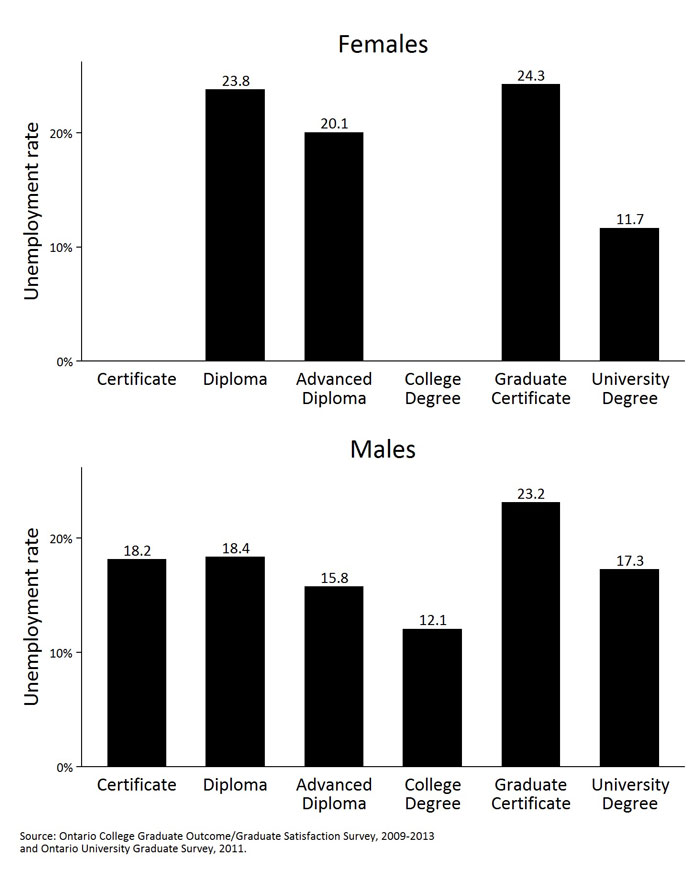
Figure 52: Unemployment rate for college and university engineering graduates by program length, gender and age group, NHS, 2011
Indicator 3: Labour force participation
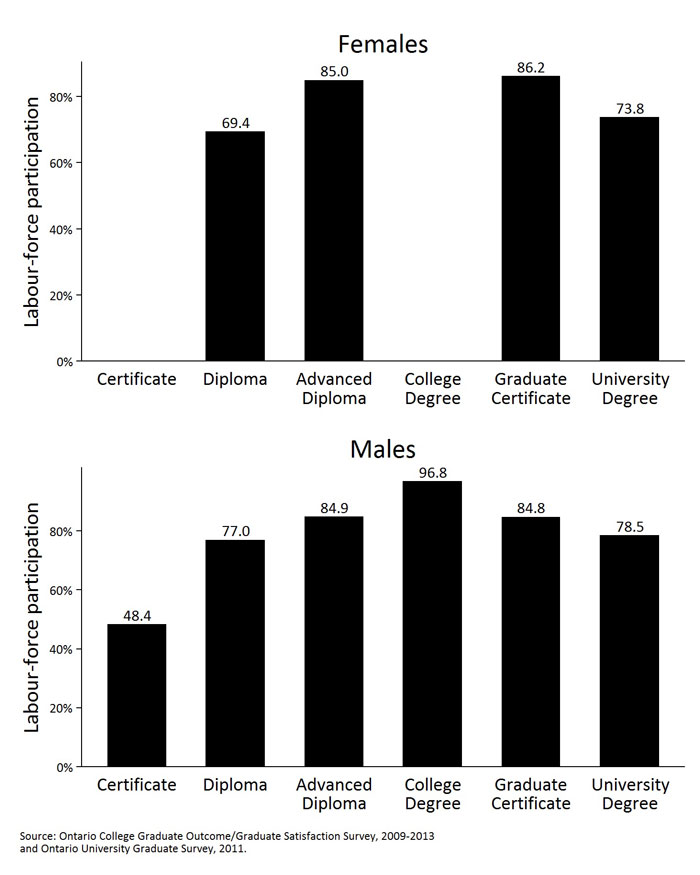
Figure 53 presents GOSS and OUGS labour force participation rates for Engineering program graduates across college and university credentials, by gender. For female graduates, labour force participation rates are highest for graduate certificate and advanced diploma graduates, while participation for university degree graduates is considerably lower. Male graduates exhibit a similar pattern, with college degree graduates exhibiting the highest level of labour force participation, university degree graduates exhibiting a lower level of labour force participation equivalent to that of diploma graduates, and the lowest level of participation observed in certificate graduates.
Figure 53: Labour force participation rate for college and university Engineering graduates six months post-graduation by credential type and gender, GOSS, 2009-2013 (pooled) and OUGS, 2011
Indicator 4: Returned to school
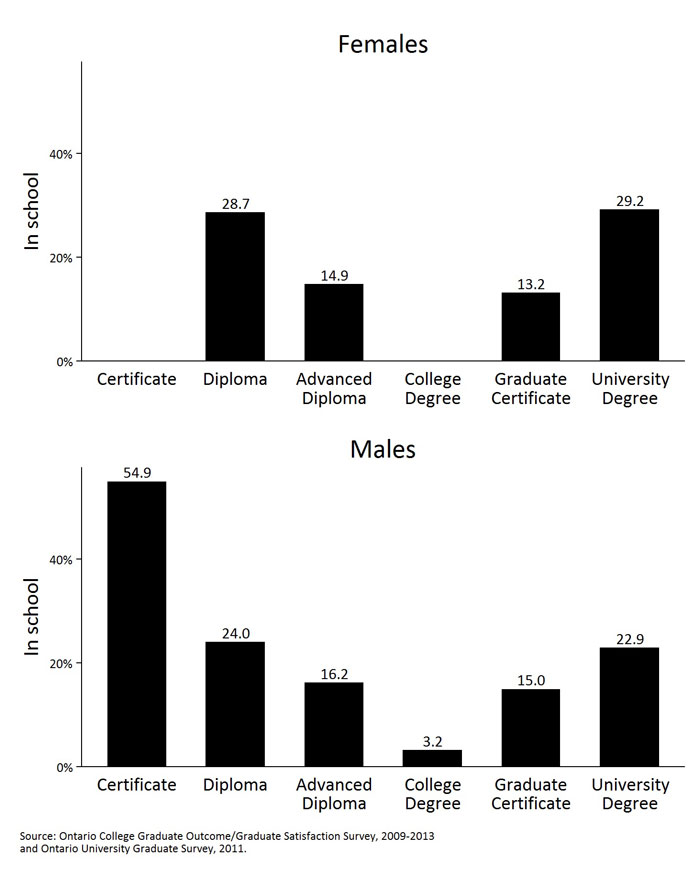
Figure 54 presents GOSS and OUGS rates of returning to school for further education for Engineering program graduates across college and university credentials, by gender. For females, university degree and college diploma graduates are considerably more likely to return to school than advanced diploma or graduate certificate graduates. Male graduates exhibit a similar pattern of returning to school, with university degree graduates returning to school at a similar rate to college diploma graduates, and at a much higher rate than advanced diploma or graduate certificate graduates. Furthermore, male certificate graduates are much more likely than graduates of any other credential to return to school while degree graduates are much less likely to return to school than graduates of any other credential.
Figure 54: Percentage of college and university engineering graduates that returned to school within six months of graduation, by credential type and gender, GOSS, 2009-2013 (pooled) and OUGS, 2011
| BUSINESS | |||||||
| Gender | Certificate | Diploma | Advanced Diploma | College Degree | Graduate certificate | University degree | |
|---|---|---|---|---|---|---|---|
| Annual earnings | Female | $22,160 | $25,251 | $27,935 | $31,111 | $31,678 | $41,814 |
| Male | $25,804 | $28,647 | $30,819 | $36,488 | $32,655 | $46,199 | |
| Labour-force participation | Female | 63.7% | 78.8% | 72.7% | 90.7% | 89.9% | 89.5% |
| Male | 60.4% | 76.8% | 70.8% | 92.7% | 85.9% | 92.6% | |
| Unemployment rate | Female | 21.8% | 20.5% | 18.1% | 13.7% | 18.5% | 13.4% |
| Male | 24.7% | 21.6% | 19.3% | 13.5% | 23.2% | 16.9% | |
| In school | Female | 36.2% | 22.0% | 30.6% | 9.5% | 9.6% | 19.4% |
| Male | 40.6% | 24.4% | 32.9% | 8.9% | 14.6% | 13.6% | |
| ENGINEERING* | |||||||
| Gender | Certificate | Diploma | Advanced Diploma | College Degree | Graduate certificate | University degree | |
|---|---|---|---|---|---|---|---|
| Annual earnings | Female | $34,160 | $35,630 | $34,180 | $49,532 | ||
| Male | $32,608 | $35,021 | $40,250 | $47,489 | $32,960 | $54,878 | |
| Labour-force participation | Female | 69.4% | 85.0% | 86.2% | 73.8% | ||
| Male | 48.4% | 77.0% | 84.9% | 96.8% | 84.8% | 78.5% | |
| Unemployment rate | Female | 23.8% | 20.1% | 24.3% | 11.7% | ||
| Male | 18.2% | 18.4% | 15.8% | 12.1% | 23.2% | 17.3% | |
| In school | Female | 28.7% | 14.9% | 13.2% | 29.2% | ||
| Male | 54.9% | 24.0% | 16.2% | 3.2% | 15.0% | 22.9% | |
* Due to the very small number of female Engineering graduates, we do not report outcomes for this group.
Summary of outcomes for Ontario postsecondary graduates
Postsecondary education is a solid investment – Ontario postsecondary graduates have better employment outcomes and higher earnings than Ontario high school graduates. This is true across the credential mix, but earnings premiums differ by credential in expected ways: on average, university graduates earn more than college graduates and college graduates of longer programs earn more than graduates of shorter ones.
Outcomes vary across credentials and field of study – Our analysis of the college and university sectors shows that labour market outcomes differ substantially across both credential types and fields of study pursued. University KPI data revealed considerable differences in labour market outcomes across fields of study, with Engineering, Education, and Business graduates attaining better outcomes than Social Sciences, Humanities, and Agricultural and Biological Sciences graduates. College KPI data shows that graduates of some advanced diploma and degree programs in applied areas of study have strong labour-market outcomes, and sizable proportions of graduates attain jobs related to their studies six months after graduation. However, it should be noted that college graduate outcomes are also highly dependent on field of study, and while outcomes of advanced diploma and degree programs in applied areas of study are generally strong, outcomes of male post-diploma certificate graduates are relatively poor.
Earnings have declined and unemployment rates have risen for recent graduates – Ontario’s recent graduates were significantly affected by the recession. In 2009, unemployment rates at six months after graduation spiked and earnings declined for both college and university graduates. Five years after the economic crisis, neither earnings nor unemployment rates have fully recovered. Young people with less education were also affected.
Poor employment and earnings outcomes are a ‘medium-term’ problem – Even two years after graduation, unemployment is higher than the provincial average for graduates in several fields of study. (We lack comparable college graduate 2-year data.) While this is somewhat troubling, we also know that this is a ‘medium term’ problem. Data from the Labour Force Survey indicate that by age 27-29, on average, graduates have established themselves in the labour market. Unemployment rates for postsecondary graduates in this age group are below the provincial average.
Transitions are more challenging for some fields of study – Recent graduates in Sciences, Humanities, and Social Sciences have higher unemployment rates and lower earnings at six months and two years compared to the mean outcomes of all graduates from all fields of study. According to the new survey of Canadian University Baccalaureate Graduates, this disadvantage persists six and seven years out. While our analysis using NHS data shows that Social Science graduates fully ‘catch-up’ to the average earnings by age 30-34, the earnings of Humanities graduates improve, but they only partially catch-up.
Smoothing the transition from school to work is a critical issue – The transition from school to work is a challenging period in many postsecondary graduates’ lives. While our analysis suggests that this transition is relatively short for most graduates, it also suggests that there may be opportunities to improve the transition, allowing graduates to reach their economic and social potential more quickly.
1 Recall that Statistics Canada considers full-time students as labour market participants if they are employed or seeking part-time employment. Full-time students seeking full-time employment are assumed to be seeking co-op or summer employment.


