Chapter 2 – Evaluating employer needs
Introduction
Aspects of employer need considered
For the purposes of this review, we will consider two aspects of employer need:
- Demand – Does employer demand vary by credential type? Is there evidence of increasing or declining employer demand for certain credentials over time?
- Satisfaction – Are employers satisfied with their hires from Ontario's postsecondary system and does employer satisfaction vary by credential type?
Our approach
Our analyses draw from the key insights of the previous chapters on student needs, which examined graduate earnings, unemployment and employment in related fields, as well as an examination of employer satisfaction data from the College Employer Satisfaction Survey (ESS). Employer satisfaction data are collected through surveying the employers of graduates who respond to the Graduate Outcomes/Graduate Satisfaction Survey (GOSS).
We also draw on recent literature, such as recent studies of Canadian employers on their satisfaction with the skills available in the Canadian labour market, related to either their current employees (Stuckey & Munro, 2013), job-applicants in general (Workopolis, 2012), recent graduates in general (Canadian Council of Chief Executives, 2014a), or employers' own recent graduate employees (Navigator, 2013). In addition, we consider a recent HEQCO study (Borwein, 2014) examining current hiring practices for entry-level jobs in Ontario.
We also consulted with employers/industry groups in an in-person session. Those who could not attend were invited to submit written responses.1
Outcome indicators
Table 14 provides a brief description of each indicator. Table 15 provides a more technical description of how each indicator is measured in our data sets.
| Outcome area | Indicator |
|---|---|
|
For college graduates, the data only allow us to consider earnings at six months after graduation. For university graduates, we are able to consider earnings both at six months and two years after graduation. |
|
Unemployment – The percentage of graduates in the labour force who are not working. |
| Employment in a related field – The percentage of graduates who are in work related to their field of study — based on graduates' own perceptions. | |
|
Satisfaction with graduates' skills and abilities – What skills employers consider most important, and employers' perceptions of how well graduates are trained in these skills. |
| Satisfaction with graduates' overall college preparation – How well employers perceive graduates to have been prepared for the workforce. |
| Data source | |||
Graduate outcome indicator |
Measure | GOSS and ESS (conducted 6 months post-graduation) | OUGS (conducted 2 years post-graduation) |
|---|---|---|---|
|
Total annual earnings before taxes and deductions among employed graduates. Indexed at 2010=100, Consumer Price Index for Ontario. | Self-reported gross earnings at time of survey. | Self-reported gross earnings at time of survey and retrospective to 6 months post-graduation. |
|
Among graduates in the labour force, the percentage who are unemployed. | Self-reported employment status at time of survey. | Self-reported employment status at time of survey and retrospective to 6 months post-graduation. |
|
Among employed graduates, the percentage who are working in a field related to their postsecondary education. | Self-report of employed graduates working in a “job related to the program that [they] graduated from” at time of survey. (Graduates responding “Yes, partially” are coded as not being in related work.) | Self-report of employed graduates on how closely related their work was “to the skills they acquired through the program of study” at time of survey. (Graduates responding “Somewhat related” are coded as not being in related work) |
|
Among employers of graduates, how would they rate the importance of various skills, and how satisfied are they with the preparation their employees have received in these skills. | Employer rating of skills being “Important” or “Extremely important”, and employer report of being “Satisfied” or “Very satisfied” with employees' college programs' development of these skills. | No data collected. |
|
Among employers of graduates, how they rate employees' overall college preparation for the work they are doing. | Employer report of being “Satisfied” or “Very satisfied” with their college graduate employees' overall preparation for the workplace. |
No data collected. |
Employer demand
Employer demand is not directly observable, and for that reason we study it using proxies, including graduates' earnings, unemployment, and relatedness of graduates' work to their program. These are standard measurements for representing labour market demand (Williams, 2004). In our analysis, graduate outcomes are valuable for assessing employer demand because employers should be willing to make more frequent employment offers and offer higher wages to graduates with skills and abilities that better meet their labour needs. In the literature, we find attempts at measuring employer demand using projections of future labour market demand, employer surveys, and analyses at the sectoral, regional and occupational levels based on changes in unemployment rates, earnings and vacancy rates.
Analyzing graduate earnings, unemployment, or relatedness of graduates' work in isolation of one another to measure demand may be misleading, because graduates may respond to demand in ways that alter the meaning of measured outcomes. For example, certificate graduates may have to accept work that is unrelated to their college program, which would lead unemployment rates to understate a lack of specific demand for their credential.
Examining these three indicators together provides a fuller understanding of overall employer demand for graduates of specific credentials. For our analysis, data were not available on student characteristics that might be associated both with acquiring particular credentials and with labour market outcomes; therefore, the associations we find between credentials and outcomes could be subject to bias stemming from these characteristics.
There are caveats related to what we find in other literature as well. Projections of future demand, as discussed in the literature, are unavoidably extrapolations based on historical trajectories; for this reason they are subject to unforeseen shocks (Usher, 2013). Surveys of employers should also be understood in the context that employers are transactors in a market for skilled labour where they do not set prices; it is natural that they would perceive scarcity.
A note about the supply of graduates
While graduate earnings and unemployment rates are closely linked to levels of employer demand, alone they are only able to present a partial picture because they are also influenced by the supply, or number of graduates with a given credential in the labour market. For example, a graduate may earn high wages due to high employer demand for their credential, a low supply of their credential in the market, or a combination of both. Therefore, to interpret the first two indicators, an understanding of the supply of credentials in the labour market is necessary.
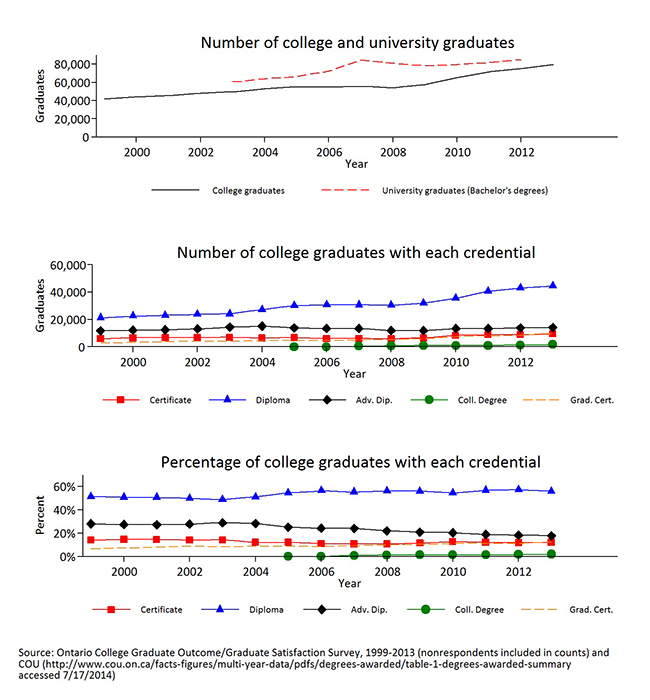
To provide a broad context of the change in supply of recent entrants into the labour market of postsecondary educated labour, we look at one major source of labour market supply, which is the supply of new graduates from Ontario colleges and universities. The top panel in Figure 55 presents the number of graduates from Ontario colleges and universities entering the labour market in the last 15 years. It shows considerable increases in the number of both college and university educated labour-market entrants over time. The number of university entrants has leveled off somewhat since the graduation of Ontario's double cohort, but the number of college entrants has increased considerably since 2009.
The middle panel in Figure 55 presents the number of college graduates by credential using the GOSS 1999-2013. It shows that diplomas have been by far the most common credentials awarded by colleges, and that the number of diplomas awarded has increased dramatically, more than doubling from 1999 to 2013. The numbers of other credentials has shown equally large growth proportional to the 1999 numbers, with over twice as many certificates and over three times as many graduate certificates awarded in 2013 as in 1999. The increase of advanced diplomas has been considerably smaller over this time period, potentially due to changes in credentials in specific programs. Though degrees were by far the least common credential awarded by colleges, they have shown significant growth since the first graduates appeared in the 2005 GOSS.
The bottom panel of Figure 55 reframes these trends in the context of the proportion of total college graduates with each credential level. It indicates that the relative supplies of diploma and certificate graduates have remained more or less stable over time, while the relative supply of advanced diploma graduates has decreased by roughly 10 percentage points from 1999 to 2013, and the proportion of graduates receiving graduate certificates nearly doubled from 1999 to 2013. The proportion of degree graduates grew significantly from 2006 to 2009, but has recently flattened.
Figure 55: Number of university and college graduates, and proportion of college graduates by credential, GOSS, 1999-2013
Indicator 1: Unemployment
We expect unemployment rates to reflect employer demand for a credential relative to the supply of that credential, as graduates of credentials in greater demand should have a much higher probability of securing employment.
Unemployment rates suggest employer demand for Ontario credentials is growing in line with supply
Figure 56 shows the unemployment rate for college credentials six months after graduation. Unemployment rates over time are more difficult to interpret than earnings as an assessment of employer demand, due to the large spike in unemployment associated with the 2009 recession and its aftermath. However, trends in the figure before and after the recession indicate no long-term trends in unemployment for graduates (excepting a temporary spike in the early 2000s). A lack of growth in unemployment in conjunction with high growth in the supply of graduates again indicates that employer demand for graduates has increased in line with supply, with the exception of a drop in demand following the 2009 recession.
College unemployment rates indicate higher demand for degree graduates
As Figure 56 suggests, demand for college degree graduates was higher over the period considered than for graduates of any other college credential, perhaps explained by the small number of graduates of college degree programs. Unemployment in the recent period is roughly equal across other college credentials. Recall from the discussion of earnings in Chapter 1, however, that differences between those with certificates and other credentials increased conditional on field of study, suggesting that diploma and advanced diploma graduates are in greater demand than certificate graduates. Male graduate certificate graduates have consistently higher unemployment rates than other graduates, while female graduate certificate graduates have unemployment rates on par with graduates of other credentials, except for degrees. Similarly, female graduates have lower unemployment rates than male graduates across all credentials.
University graduates unemployment increases with 2009 recession, then declines
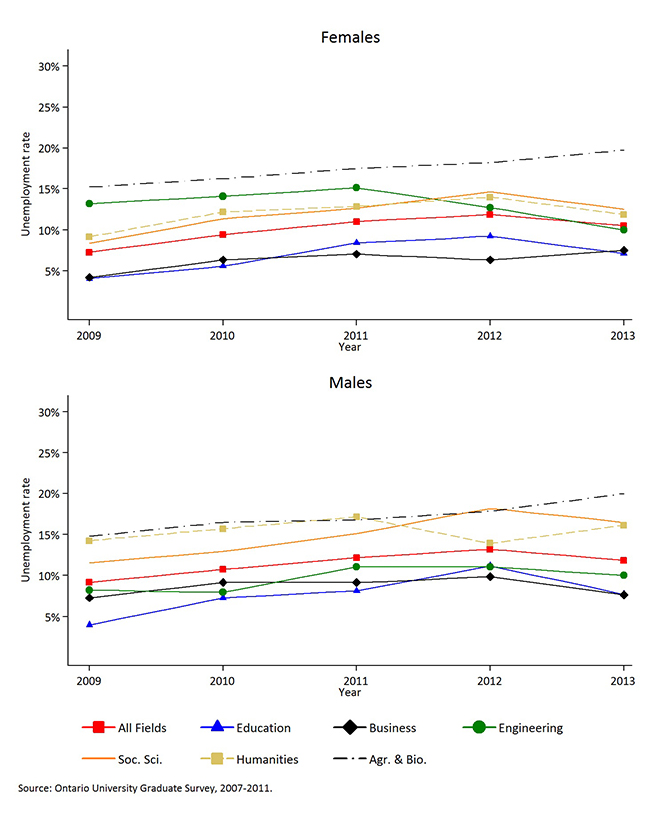
As discussed in Chapter 1 and as shown in Figure 57, unemployment for newly graduated Ontario university baccalaureate graduates increased slightly between 2007 and 2010, with a slight improvement between 2010 and 2011. Figure 58 shows that unemployment rates increased between 2009 and 2012 for university graduates who had completed their degree two years prior, with slight improvement in 2013. Unemployment rates for university graduates varied considerably by field of study.
Figure 56: Unemployment rate for college graduates, six months after graduation, by credential and gender, GOSS, 1999-2013
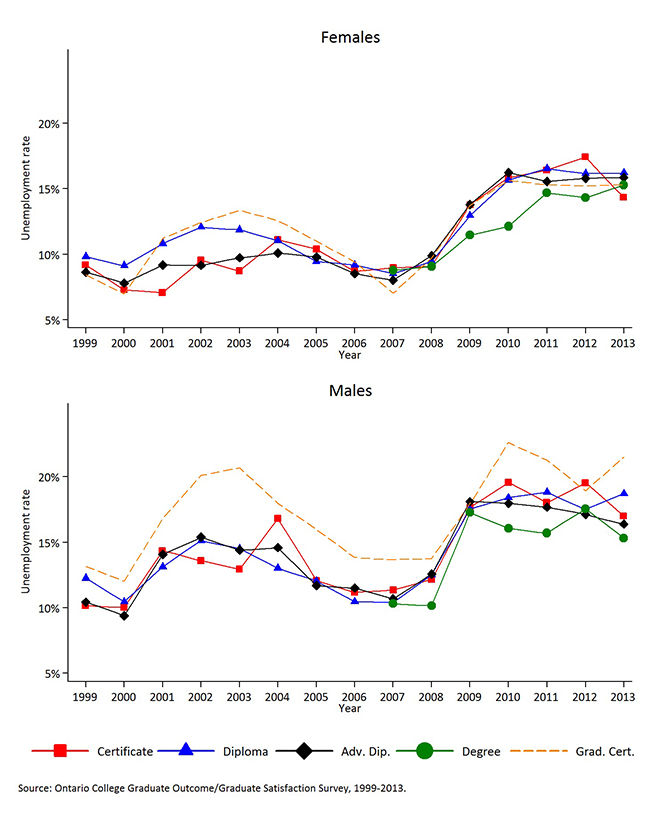
Figure 57: Unemployment rate for university graduates, six months after graduation for six FOS, by gender, OUGS, 2007-2011
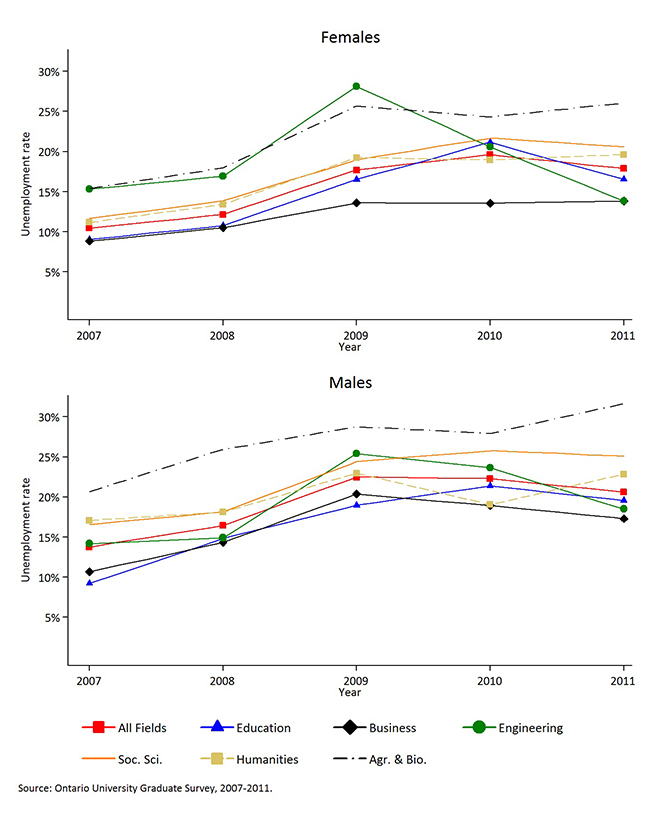
Figure 58: Unemployment rate for university graduates, two years after graduation for six FOS, by gender, OUGS, 2009-2013
Indicator 2: Graduate earnings
College earnings data indicate higher employer demand for higher credentials
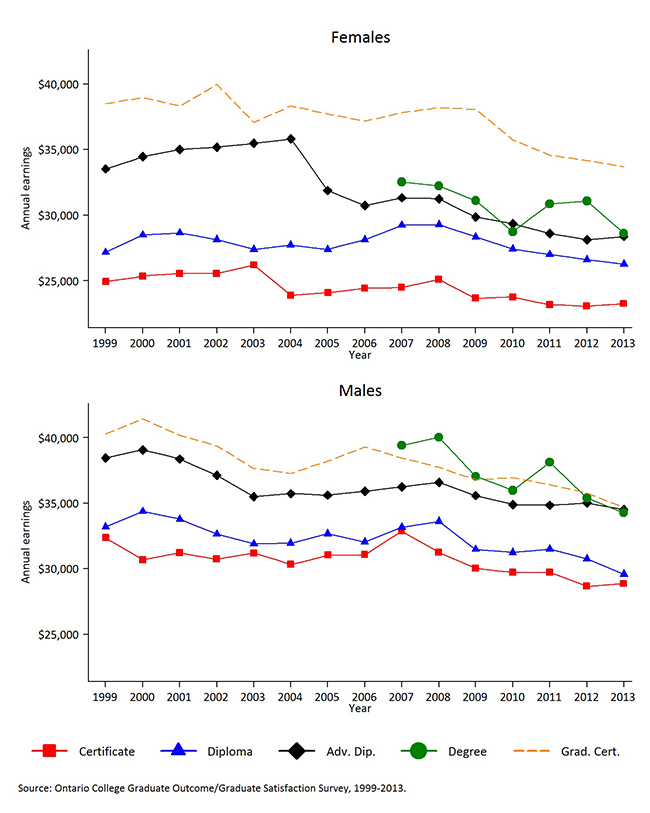
As discussed in Chapter 1 and shown in Figure 59, in general, employers are willing to pay more for graduates of more advanced programs. Individuals with either a college degree or a graduate certificate (most of whom already have university or college degrees) have the highest earnings. This pattern suggests that employers recognize differences between the graduates of different programs and are willing to pay a premium for the differences they perceive, consistent with standard human capital models of returns to education (Oreopolous & Salvanes, 2009). In recent years for male graduates, however, there has been a convergence of earnings for graduates holding degrees, advanced diplomas, and graduate certificates. Similarly, the earnings for male certificate and diploma graduates have also converged recently. Conversely, female graduate certificate graduates earn significantly more than female graduates of any other credential, including degrees.
Despite decline in college earnings, data suggest employer demand growing proportionally with supply of graduates
In addition, Figure 59 indicates that real earnings have declined for all college credential levels over time. This decline however, has been relatively small, and only slightly below the general trend of wage stagnation for new labour market entrants in Ontario between 1999 and 2011 (Statistics Canada, CANSIM Table 202-0407). Taking into account the growth in supply of credential graduates since 1999, relatively stable earnings levels indicate that employer demand for each credential has grown nearly proportionally with supply.
This trend holds for all college credential types, with the exceptions of advanced diplomas and college degrees. The number of advanced diploma graduates has not grown over time in a similar way to other credentials, and in fact has contracted as a proportion of total graduates, while experiencing a similar decline in earnings in the wake of the recession. The decline may also vary by field of study. As observed in Chapter 1, the proportion of female college graduates in health-related advanced diplomas fell drastically from 2004 to 2006. This drop is related to the conversion of advanced diploma nursing programs to collaborative degrees.
Figure 59: Mean annual earning of college graduates six months after graduation, by credential and gender, GOSS, 1999-2013
University graduate earnings decline slightly, and vary by field of study
The labour market continues to absorb university graduates, although with a slight decline in earnings over the past five years. While part of the overall decline in earnings of university bachelor's degree graduates may be due to changing earnings premiums associated with the bachelor's degree, it is important to understand these longer term structural trends in the context of short-term business cycle effects. As Figures 60 and 61 show, much of the decline in earnings occurs from 2008 to 2011, in line with the timing of the global financial crisis and subsequent recession. This decline is consistent with the broader decline in earnings across the labour force (not just for recent graduates). Thus, these earnings results should be interpreted not simply as trends in earnings capacity associated with achieving the credential, but also as a reflection of unfavourable macroeconomic and labour market conditions.
University graduate earnings, six months after graduation
Figure 60 presents mean earnings for university graduates six months after graduation. The figure shows that there are large earnings differences across fields of study. Engineering, and business graduates have higher earnings; and social sciences, humanities, and agricultural & biological sciences graduates have lower earnings.
Overall, earnings declined during the recession, and had not recovered to pre-recession levels by 2011. These declines are greater in some fields of study, such as Social Sciences and Education.
University graduate earnings, two years after graduation
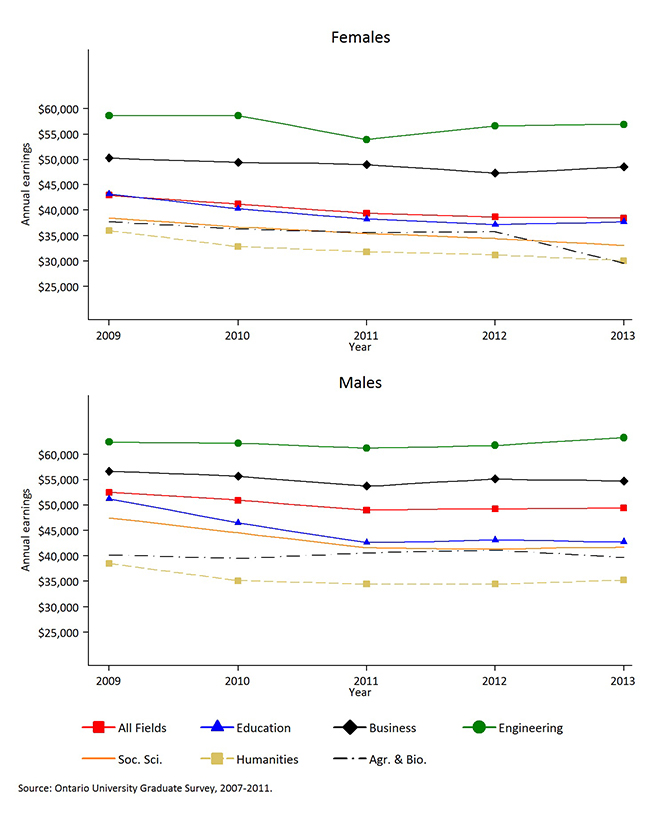
Figure 61 shows mean earnings for university graduates two years after graduation. Comparing Figure 60 and Figure 61 suggests a gradual decline in earnings for degree graduates between 2007 and 2011, which is observed for males and females and at both six months and two years post-graduation.
Female engineering graduates who graduated in 2009 experienced a substantial decline in earnings two years after graduation (in 2011), but earnings of more recent graduates have rebounded. Earnings of male graduates from agriculture and biology programs remained generally constant, while female graduates experienced a noticeable decline in earnings in 2012.
At the beginning of the time series, earnings of education graduates were nearly identical to the mean earnings for all fields of study; however, earnings of education graduates fell more sharply, so that by the end of the time series, education graduates earned slightly less than the mean earnings for all graduates. This pattern holds for earnings at six months and two years post-graduation.
Figure 60: University graduate mean earnings, six months after graduation, OUGS, 2007-2011
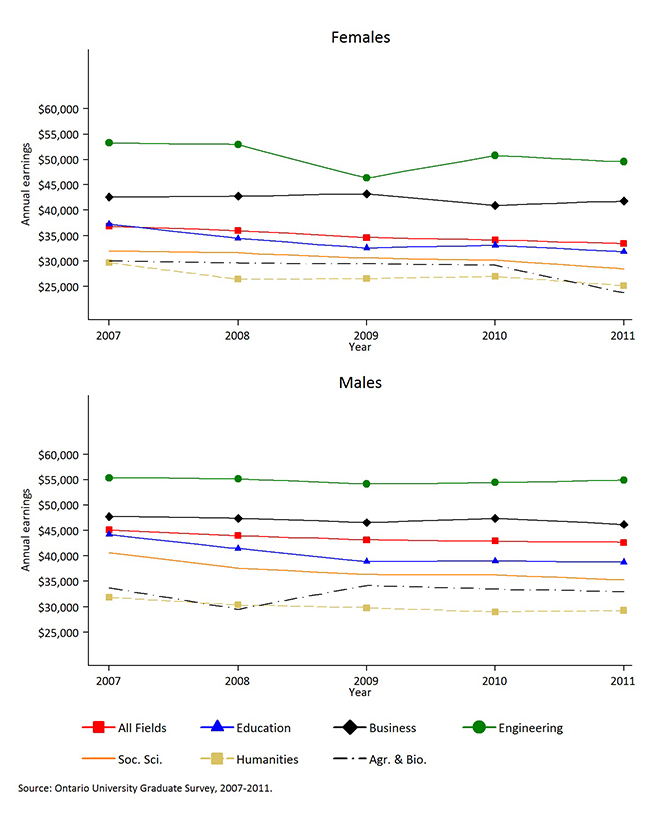
Figure 61: University graduate mean earnings, two years after graduation, OUGS, 2009-2013
Indicator 3: Employment relatedness to education
Employment relatedness by credential and over time
Relatedness of a graduate's education to their obtained employment may reflect specific demand for their credential. This match is particularly important for labour market focused credentials, as the education received is generally focused on a specific set of occupations.
Based on the wider survey literature, employers report difficulties finding skilled employees, but wage and unemployment data suggest difficulties are regional and occupation-specific
In the literature relating to employer demand, several recent surveys of employers across Canada (Stuckey & Munro, 2013; Environics, 2014; Canadian Council of Chief Executives, 2014) and Ontario (Navigator, 2013 report commissioned by Colleges Ontario) found that employers report difficulties finding skilled employees. As discussed at the beginning of the chapter, employer perceptions are not enough to give a clear picture of employer demand. Strategies that help to complete the picture include examinations of relative changes in salaries and unemployment over time (between for example: occupations, credentials, regions, sectors), as two recent studies have done. Using data on changes in wages and unemployment rates, Benjamin Tal (2012) found 25 occupations with signs of skill shortages. Similarly, using various data on job vacancy rates, TD Economics (2013) found no national skill mismatch, but evidence of regions and occupations where labour markets are tighter than the rest of Canada. At the level of credentials, Rick Miner (2010; 2014) and Employment and Social Development Canada (2013) both predict continued increasing demand for PSE credentials, but they do not make claims about the particular mix of credentials that will be required.
Percentage of college graduates in related work declined over time across all credentials
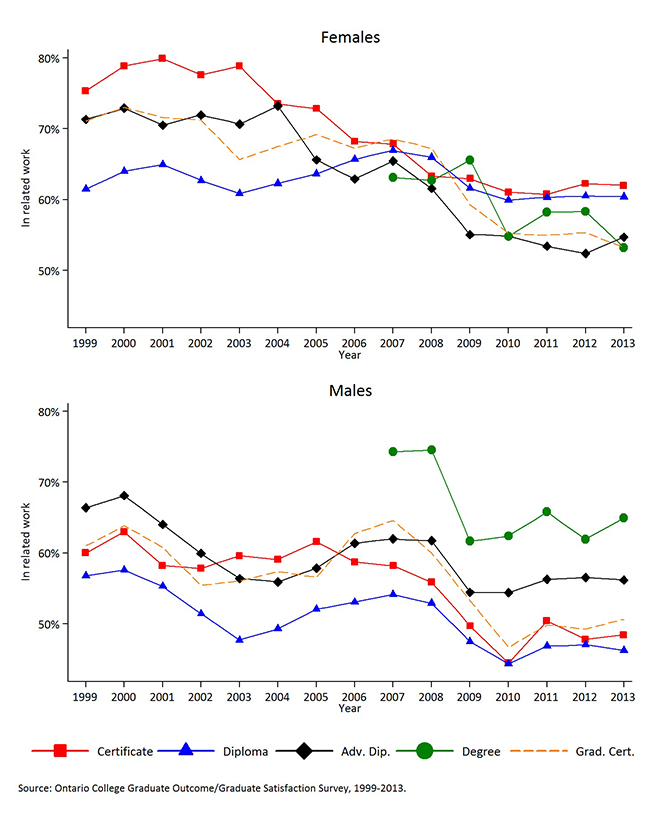
The percentage of college graduates in related work has declined (Figure 62). This decline is most pronounced around the time of the recession, and seems to have stabilized after 2009. This decline occurred in roughly the same magnitude for all college credentials, though relatedness declined slightly less for male advanced diploma graduates. Differences in relatedness across college credentials narrowed for female graduates after 2005. Male degree graduates are most likely to be in related work in spite of a large decline in 2009, and advanced diploma graduates are second most likely after 2008.
Figure 62: Percentage of college graduates in related work, GOSS, 1999-2013
University graduates experienced slight decline in related work, varying by field of study
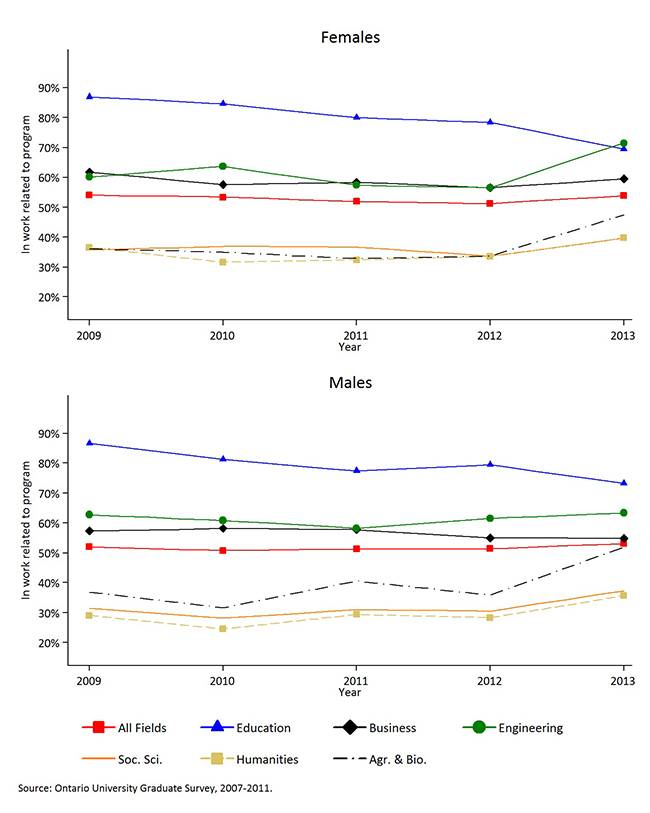
As discussed in Chapter 1 and shown in Figures 63 and 64, there was a slight decline in relatedness of work to skills acquired in study between 2007 and 2011. The decline varied by field of study, occurring most for graduates of education programs and least for graduates of business and engineering programs. Again, the 2011 OUGS question on relatedness was split into two, with one question regarding relatedness of graduates' work to the skills acquired through their postsecondary study, and the other asking about the relatedness to the subject matter of the program of study. Our decision to use the results from the relatedness to subject matter of the program of study is likely responsible for the differences between 2010 and 2011 results.2
Figure 63: Percentage of employed university graduates whose work is related to skills acquired in program of study six months after graduation, for all graduates and by six FOS, by gender, OUGS, 2007-2011
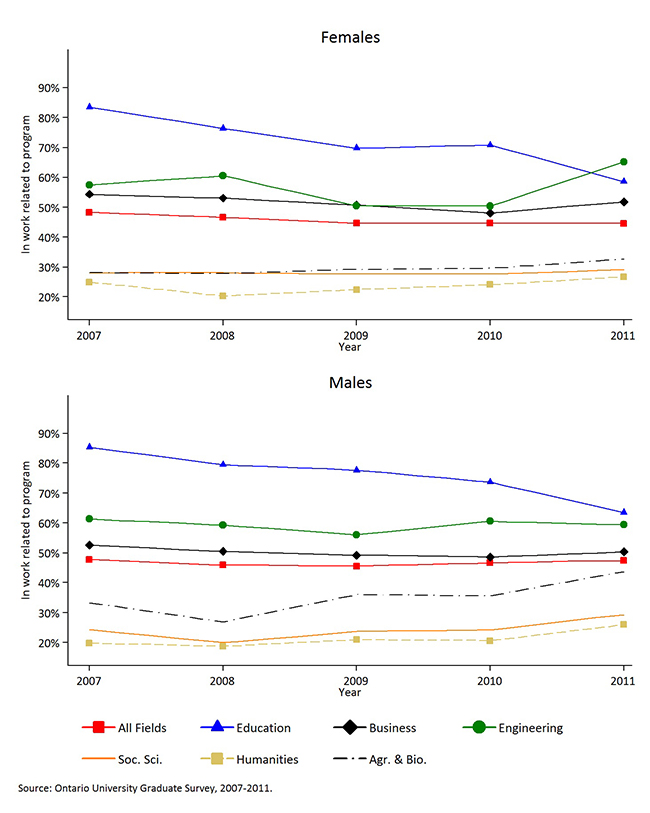
Figure 64: Percentage of employed university graduates whose work is related to skills acquired in program of study two years after graduation, for all graduates and by six FOS, by gender, OUGS, 2009-2013
Indicator 4: Employer satisfaction
Employer satisfaction can be measured directly through surveys that ask employers to indicate their satisfaction levels with the graduates they have hired and indirectly through studies of employers' hiring practices. In our analysis, we use the Employer Satisfaction Survey (ESS), which is administered to the employers of college graduates who have completed the College Graduate Outcomes/Satisfaction Survey (GOSS). These data provide direct indicators of how employers view the college graduates they hire, including both their skill levels and how their education has generally prepared them for employment. Unfortunately, there is no university equivalent.
To analyze employer satisfaction using the ESS data, we use two core measures: employer satisfaction with a group of specific graduate skills and employer satisfaction with overall workplace preparedness. For the first measure, employers are asked a two-part question. The first part of the question asks employers to identify the skills that are important for the employee's current position. The second part of the question asks employers how satisfied they are with the employee's educational preparation for those skills. As a result, we are able to observe (1) which skills employers are seeking of the college graduates they hire, and (2) employer perceptions about the ability of college education to develop these skills. The second measure, employer satisfaction with overall workplace preparedness, is one-dimensional. Employers rate their employee's overall college preparation on a five-point scale, ranging from “Very dissatisfied” to “Very satisfied.”
Although the survey questions ask employers to speak to an employee's college preparation, it is unclear to what degree employers are able to disentangle the impact of the college credential from the employee's prior education, work experience, or other ability not attributable to their college education. Associations we find between credentials and satisfaction outcomes could be subject to bias stemming from these factors. Secondly, since graduates must grant permission on the GOSS for their employers to be surveyed, it is possible that our measures are for a non-representative subsample of graduates or a non-representative group of employers. This concern is addressed in Appendix D.
Employers' perception of importance of skills
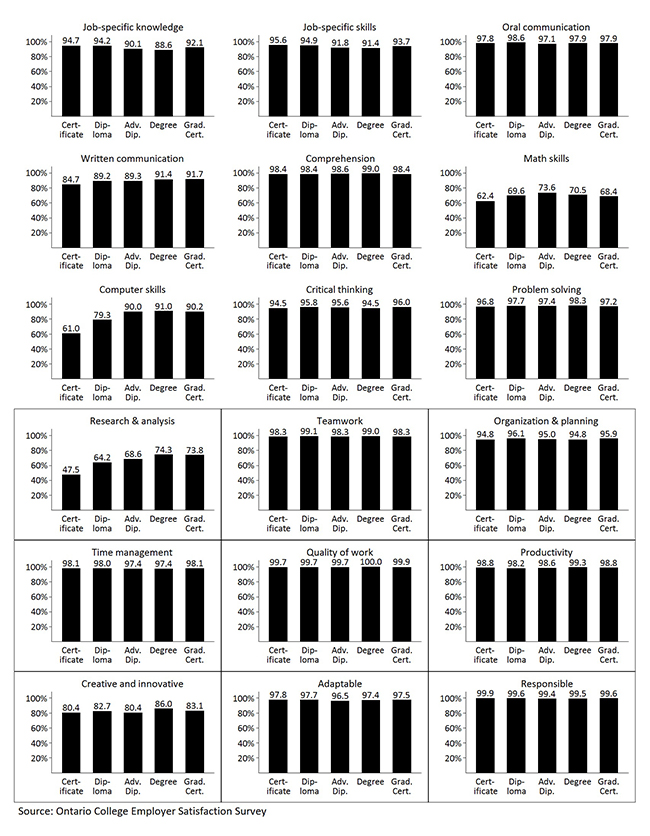
We analyzed the data to identify the most important skills and abilities reported by employers in the work of college graduates, and then examined the extent to which employers were satisfied with the educational preparation of graduates related to these skills and abilities. Figure 65 presents the proportion of employers responding “Important” or “Very important” for each skill by college credential. We pool data from 2009 to 2013.
Some skills are reported to be more important than others
As Figure 65 shows, some skills were rated by employers to be more important than others. For example, quality of work, teamwork, and time management were seen as “Important” or “Very important” by far more employers than math skills and research and analysis skills, which is unsurprising given the relevance of the former set of skills and abilities in almost all occupations. The value employers attach to these types of skills and abilities varies little across credentials, This is consistent with a focus we have observed in the literature of employer surveys, both in Canada (CCCE, 2014) and internationally (Hart Research, 2013; Conference Board, 2006; Humburg et al., 2013) on prioritizing soft or “non-cognitive” skills.
More complex cognitive skills reported to be more important for more advanced credentials
There are notable differences across credentials for some skills and abilities. For example, written communication, math skills, computer skills, and research and analysis were more important for graduates of more advanced programs. For example, employers reported that computer skills were more important for diploma (30%), advanced diploma (48%), degree (48%), and graduate certificates (48%), respectively, relative to certificate graduates. One way to characterize these skills and abilities is that they are more cognitive in nature, whereas the skills and abilities for which ratings of importance varied little across credentials are more non-cognitive and behavioural. Thus the pattern suggests that while most employers sought many of the same skills and abilities in all of their college-educated employees, they had different expectations from graduates with different credentials for some skills and abilities. This seems consistent with the nature of more advanced programs, which aim to develop a broader understanding of the discipline and analytical skills inside and outside of the discipline, and the ability to use one's judgment for planning and selecting appropriate techniques and approaches, even in applied areas of study.
Figure 65: Proportion of employers reporting that abilities are "Important" or "Very important" in the graduate's work, ESS, 2009-2013 (pooled)
Employer satisfaction rates were roughly equal across credentials for many skills and abilities
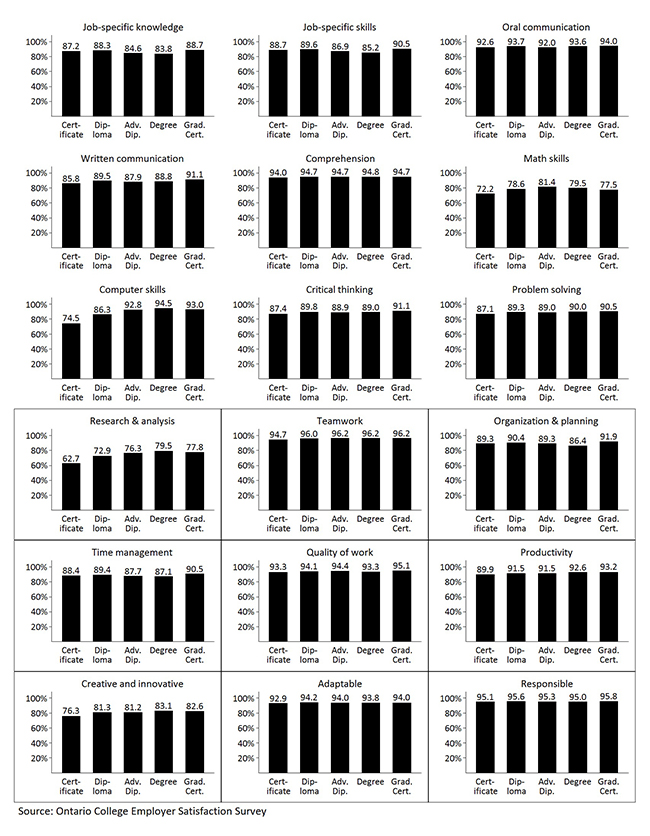
Figure 66 presents the percentage of employers responding “Satisfied” or “Very satisfied” with the ability of the college programs from which their employees graduated to develop the 18 skills and abilities listed in the ESS. Satisfaction was roughly equal across all credentials for the skills and abilities that we expected to be important across almost all occupations (e.g., being responsible). However, satisfaction across credentials varied for some other skills and abilities that were not as important in some jobs compared to others (for example, more narrow cognitive skills).
Employer satisfaction with more complex cognitive skills was higher for more advanced credentials
Figure 66 shows that satisfaction was generally higher for graduates of more advanced programs for the skills and abilities that employers consider more important in their work, such as written communication, computer skills, research and analysis, and so on. This indicates that employers perceived these cognitive skills to be more valuable in the work done by graduates of advanced programs and that employers were more satisfied with these graduates' training in these areas.
Figure 66: Proportion of employers reporting that they are "Satisfied" or "Very satisfied" in the graduate's work, ESS, 2009-2013 (pooled)
Employer satisfaction with overall work preparation high and largely invariant across credential level
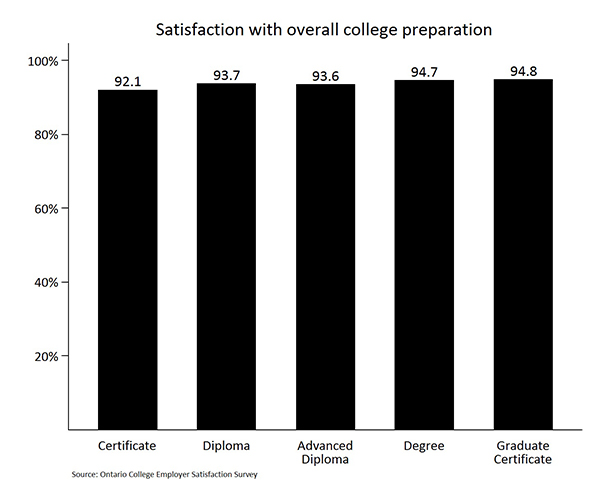
We also examine employers’ satisfaction with their employee’s overall college preparation for the type of work they are doing. Using the same sample used in Figures 65 and 66, Figure 67 presents the percentage of employers responding either “Satisfied” or “Very satisfied” with the overall preparation of their graduate hires. As Figure 67 shows, overall employer satisfaction is high for graduates across all college credentials. There is little variation across graduates with different credentials, excepting slightly higher levels of overall employer satisfaction for graduates with more advanced credentials.
Figure 67: Proportion of employers reporting that they are "Satisfied" or "Very satisfied" with the overall preparation graduates received for the work they are doing, ESS, 2009-2013
Employer satisfaction in recent literature
Comparing our findings to existing literature is difficult, because the literature from employer surveys does not present a consistent picture due to differences in the populations involved (e.g., Ontarian employees in general, Canadian job-seekers in general, recent graduates in general, recent graduates employed in the survey participant’s company) and differences in the kinds of skills about which employers were asked. In a survey by the Conference Board of Canada (Stuckey & Munro, 2013), over 70% of employers in Ontario found their employees lacked sufficient critical thinking ability. As the survey was not restricted to employers of recent graduates, it is unclear how much of this can be attributed to the PSE system. Workopolis surveyed Canadian employers on their perceptions of job applicants in general, and found that 67% reported deficiencies in soft skills (Workopolis, 2012). The Canadian Council of Chief Executives (2014) found that more than a quarter of Canadian employers surveyed were either neutral or dissatisfied with the skills of recent graduates. However, this does not tell us which skills they found most lacking. In a survey prepared for Colleges Ontario (Navigator, 2013), 43% of Ontario employers found the PSE system to be neutral, unsuccessful or very unsuccessful for preparing qualified applicants for their organization. Since our analysis of the College Employer Satisfaction Survey was restricted to employed Ontario college graduates, it is not clear whether it conflicts with the findings of any of these surveys, which asked questions about different populations and more general skills.
A recent HEQCO study (Borwein, 2014) analyzed job postings and found that employers expect an average of 1.4 to 2 years of experience from applicants to entry-level positions. This is consistent with the Canadian Council of Chief Executives (2014) survey finding that fewer than 10% of employers hired employees without experience for entry-level positions, and that more than 60% of them hired employees with up to two years of experience. It is also consistent with a recent HEQCO survey (Sattler & Peters, 2012) finding that of Ontario employers who had hired recent graduates, they mostly hired graduates that had experience through work-integrated learning at the firm.
It has been expressed anecdotally (Lin, Sweet & Anisef, 2003; Dehaas, 2014) that employers use work experience as a signal for soft or “non-cognitive” skills. However, since there is no consistent evidence of a perceived soft skills deficiency, we cannot offer a clear explanation for why employers are prioritizing experience. Furthermore, we do not know if this emphasis on experience represents a change over time. What is expressed consistently in the literature (OCC, 2014; Stuckey & Munro, 2013; Globe and Mail, 2014; Usher, 2013) is that better labour market information would allow researchers to more accurately address the question of whether there exists a skills gap in Canada, and if so, in what sectors and regions it exists.
What we heard from employers
Employers were invited to participate in a consultation session to provide their perspectives on Ontario’s credentials within the context of hiring decisions, and input on opportunities for employer involvement in postsecondary education, and on new design and delivery models for improving labour market transitions of graduates.
Employer/industry groups and selected employers were directly invited to participate in an in-person consultation session. An effort was made to include representation from a diverse range of industries and geographic regions of the province. We also aimed to engage large employers that had broad geographic reach and that hire from a broad range of fields of study.
Employers were identified by SRDC and first contacted by the Ministry through formal letters from the Assistant Deputy Minister. This was followed shortly thereafter with a formal invitation sent by SRDC via email inviting them to an in-person consultation session. Organizations that could not attend in-person consultations were encouraged to provide written responses to the discussion questions developed for the in-person sessions.
The Centre of Excellence in Financial Services Education (CoE), the Information Technology Association of Canada (ITAC), GM, and IBM ultimately participated.
Topics covered in consultations with employers included the following:
- Credentials, skills and the hiring and promotion process
- Skills and competencies prioritized when hiring recent graduates
- Gaps and opportunities related to the design and delivery of Ontario’s postsecondary credentials
- Challenges and opportunities related to employers’ role in education and training.
Below we summarize our findings from in-person meetings or written submissions from these four organizations.
Credentials, skills and the hiring and promotion process
Employers were asked to identify key considerations (such as skills, work experience, credentials, institution), and the relative importance of these considerations, when hiring new staff and promoting existing staff.
When it comes to hiring new staff, we heard that technical knowledge and skills, “soft” skills, employment history and relevant experience were the most important considerations. Depending on the particular job, the specific institution or program from which the candidate graduated is also considered.
Regarding technical skills, both ITAC and CoE stated that there is a need for graduates that possess hybrid skillsets – a combination of knowledge and skills that are traditionally taught in separate fields of study. For instance, ITAC indicated there is a need in the information technology sector for graduates who possess a combination of technical IT skills and business management skills. Similarly, CoE noted that in the health insurance industry, some employers are hiring experienced nurses because of their specialized health-related knowledge, suggesting a need for candidates that possess technical financial skills and subject matter expertise.
Regarding “soft” skills, strong communication skills, as well as skills related to one’s ability to learn new knowledge and skills were noted as important, particularly for new hires of entry level positions.
Employment history, particularly the extent to which one’s work experience is related to the specific job and the industry, are also a consideration in the hiring process among new hires.
The specific institution or program from which the candidate graduated may also be considered. The extent to which this is a key consideration depends on the particular job, especially in cases where there is a strong record of performance from previous hires who have graduated from the same institution/program.
When promoting staff, it was indicated that demonstrated job performance is of most importance, and is considered to be more important than educational attainment.
Skills and competencies considered when hiring recent graduates
- Increasingly hybrid nature of skills requirements – There was a strong consensus about the increasingly hybrid nature of employment. For example, in ICT, emerging positions require a blend of knowledge and skills in information technology, business management and the specific content of the relevant industry. Similarly in the financial industry, positions may require knowledge and skills in traditional areas such as accounting with additional knowledge related to emerging applications (e.g., financial compliance). CoE also cited an increasing need for non-traditional combinations of skills and knowledge – for example, the insurance industry has recruited experienced nurses to work in the health insurance field because of their specialized health related knowledge.
- Increasing emphasis on soft skills – IBM indicated that they hire for a range of occupations, such as business consulting, technical support, software development, accounting, and human resources. Each of these roles has very different skills requirements. Each job description thus comes with a list of required skills but noted that “soft” skills or “people” skills are hard to quantify but are increasingly important. These are often identified through interviews or by examining non-academic elements of a resume or CV (club membership, leadership opportunities, volunteering experience, etc.). IBM indicated that anything that post-secondary institutions can contribute to help quantify these skills would increase efficiency and accuracy in the hiring process. GM also indicated the increasing importance of soft skills. GM stated that for entry level roles or roles not requiring specific skill sets, the focus is on soft skills and competencies related to their learning ability. GM stated that they target the following competencies during the selection process: timely decision making; functional / technical skills; integrity and trust; learning on the fly; peer relationships; drive for results; dealing with ambiguity; problem solving; and building effective teams.
Gaps and opportunities related to postsecondary education design and delivery
Broadly speaking, we heard that employers perceive that Ontario’s postsecondary system is largely on track. There was consensus that the biggest challenge for the system was keeping up with rapidly changing skill requirements associated with a dynamic labour market.
- Challenge of keeping up with rapidly changing demand – There was strong consensus about the importance of creating conditions to enable the postsecondary system to be responsive to changing skills requirements. Both ITAC and CoE indicated that the employers they represent often report that postsecondary programs are designed to meet outcomes that are no longer in demand. As a result, there is often a ‘disconnect’ between the knowledge and skills that are in demand in the sector and the knowledge and skills that graduates have.
- Need for more regional/sectoral specialization – Both ITAC and CoE suggested that one way that would enable institutions to be more responsive would be to encourage more regional specialization in which institutions focused on developing programs to meet the needs of specific regional and/or sectoral partners. Not only would this better position institutions to be responsive, but it would also reduce duplication and competition among institutions.
- Labour market information (LMI) – Both ITAC and CoE strongly stated that there is a striking lack of high quality labour market data for the province. They suggested that the province consider building on the models that have been developed in these two sectors and apply them to other key employment sectors in Ontario. They also suggested that there are excellent examples of good labour market data sources in the United States that could be emulated.
- Need for scaffolding, modularization and “hybrid” first credentials – There was strong consensus about the importance of updating educational approaches to better enable graduates to gain additional competencies outside of the core programming. CoE cited the need for scaffolding of skills and modularization of specific knowledge and skills components. Both ITAC and CoE indicated that badges and graduate certificate programs could play a role but stressed the importance of ensuring specific on-the-job performance requirements were considered in the design. Both ITAC and CoE felt that institutions should be updating their programs and ensuring that they align with current and emerging needs so that students have the knowledge and skills employers need when they graduate and do not need to add on additional years of school in order to be employable. ITAC cited the example of their new Business Management Technology program, which provides graduates with a hybrid skill set of both business and technology related competencies. Similarly, IBM pointed out that while most postsecondary education is intended to be general and to provide a solid basis for future learning, some of it will be very task or tool specific. The rate of change in high tech sectors continues to accelerate, which has created challenges for institutions to adapt in a timely fashion. Companies, including IBM, are helping by becoming partners in the process and working with academics to identify the changing trends and help produce appropriate new content.
- Value of work-integrated learning – There was also strong consensus on the value of work-integrated learning. GM indicated that they give strong preference to graduates who have completed co-op or internships as part of their school programs. They explained that students with this experience, whether with GM or not, tend to have more transferrable skills and generally adapt to the workplace much easier. GM indicated that they have a robust and longstanding student program which hires students for co-op and intern placements. GM stated “These students are an important part of our feeder stream for full-time, entry level positions. As such, more programs like co-op/internships to help students gain real work experience would be very beneficial in preparing them for labour market entry.”
- Helping graduates articulate their skills – There was also consensus that when hiring recent graduates they were not always able to articulate their knowledge and skills when interviewing for employment. CoE indicated that the employers they represent often report that graduates tend to equate the outcomes of their education in terms of technical content only (e.g., accounting) and are not able to articulate the “soft” skills that have been developed through the processes of their education. We heard that institutions need to be better at articulating the knowledge and skills that their programs are designed to develop in students - both the technical knowledge and the higher order thinking and other “soft” skills.
Challenges and opportunities related to employers’ role in education and hiring
All employers and industry groups consulted indicated that employers have a role to play in postsecondary education, such as mentorships, providing internships, and providing supports to postsecondary institutions for designing and delivering technical content that is aligned with industry needs. This belief was substantiated by several examples of how the employers and industry groups are already involved in postsecondary education:
- ITAC: ITAC provides mentors to initiate conversations with secondary school students about the importance of ICT as a career choice. They have also developed a Business Technology Management program to be offered across Canada in selected institutions. The BTM program is a four-year degree program that focuses on the development of a set of learning outcomes developed by the industry. The program learning outcomes were developed by subject matter experts, educators, industry experts and government. The learning outcomes were then tested with the industry before the program was finalized. The BTM program is currently offered by 15 institutions across Canada. ITAC plans to expand the program to 50 more institutions across the country including Polytechnics and degree-granting colleges and has a continuing education delivery model as well. Future plans include the development of a certification program for Business Technology Management professionals and potential related programs in Health Information Management and Cyber Security Management.
- GM: GM believes its role in postsecondary education is to provide meaningful work placements that expose students to work they would be doing upon graduating. They are also ensuring that students have the support they need through training and mentorship during their time with GM.
- IBM: IBM reported that it has undertaken a significant supporting role in postsecondary education by working with faculty in a number of ways to provide materials that meet the industry’s needs and that fit academic programs. IBM does not dictate the materials to be taught but chooses to provide support to the postsecondary education programs such as by providing case studies, databases, tools, teach-the-teacher training, and lecturers as needed. This is a mixture of general materials available through online programs, specific material shared by academics and industry through an online community, and in-person lectures and workshops.
Summary
Recent surveys of employers in Ontario (Stuckey & Munro, 2013; Navigator, 2013) and Canada (Canadian Council of Chief Executives, 2014) give conflicting accounts of employer satisfaction. Because the surveys present snapshots of different populations (all applicants vs. recent graduates vs. current employees, Ontario vs. all of Canada) it is not possible to draw a consistent picture of employers’ perceptions of recent graduates.
College KPI data indicates that employers are generally very satisfied with the college graduates they employ. However, they seem less satisfied when asked about specific skills or abilities, such as higher-order thinking skills (note that there is no corresponding data on employer perceptions for university graduates).
While the notion of a ‘skills gap’ remains contested, there is growing consensus among a range of stakeholders that we need to do a better job in preparing young people for the labour market (Canadian Chamber of Commerce, 2014).
Employers and industry groups that we consulted were generally satisfied with the quality of postsecondary graduates in Ontario, but reported a need for graduates with more blended skillsets that combine technical knowledge and skills from across multiple fields of study, such as skills related to ICT and business management skills. In terms of postsecondary education design and delivery, employers and industry groups indicated that programs need to keep pace with technological advancement and changing and rising skills requirements.
A HEQCO study (Borwein, 2014) of job postings in Ontario showed that employers are looking for candidates with work experience, even for entry level positions. This is consistent with findings from the recent Canadian Council of Chief Executives (2014) survey. The importance of work experience is underscored by the KPI data which indicate that work-integrated learning pays off for both college and university graduates. For both college and university graduates, work-integrated learning is associated with lower unemployment and higher earnings six months after graduation (note for university graduates we only have data on co-op).
Employer and industry groups that participated in the consultation process also indicated that work experience was a consideration in the hiring process, but also highlighted other key considerations such as technical knowledge and skills, soft skills, and depending on the particular job, the specific institution/program from which a candidate graduated.
1 Participants included General Motors (written submission), IBM (written submission), Centre of Excellence in Financial Services Education (in-person meeting), and Information Technology Association of Canada (in-person meeting).
2 The new question gives examples of the types of skills graduates developed at university: “such as critical thinking, analytical communication, and problem solving”. A question about subject matter relatedness was also added, which could affect how respondents answer the question about skills.


